
The inflation outlook in Spain
The recent relaxation in energy prices and improved outlook for food prices holds the promise of a deflationary process in Spain. That said, given the inherent volatility of these markets, coupled with still persistent core inflation dynamics, we are unlikely to see a rapid convergence to price stability targets and thus do not expect a return of expansionary monetary policy any time soon.
Abstract: Despite the volatility of the energy and food markets, as well as their vulnerability to global geopolitical tensions, these exogenous factors fuelling inflation in Spain since mid-2021 have started to wane. Assuming no major surprises on the geopolitical front, both energy and food prices will exert downward pressure on the CPI. That said, the disinflation process will be gradual, as core inflation –which remains elevated– is now determined by forces which are independent of the origin of the initial shock. Until recently, core inflation has been driven mainly by the dynamics of corporate profits. But we are now seeing some recovery in wages, thereby making for a slow disinflation outlook. Altogether, except in the unexpected advent of a recession or sharp correction in imported prices, it is unlikely that core inflation will return to its 2% target before the end of 2024. This, along with perceived risks of inflation expectations decoupling, makes it unlikely that we will see a return of expansionary monetary policy any time soon.
Introduction
Since its resurgence in mid-2021, inflation has been a key determinant of the performance of the Spanish economy. Having started out as an external shock derived from the surge in the cost of energy and imported inputs, the bout of inflation eroded the purchasing power of the economy as a whole (deterioration in the terms of trade), taking a particular toll on wage-earners and the companies more exposed to the upheaval (Torres and Fernández, 2022). As a result, internal demand, particularly household consumption, has lost momentum, dragging on growth. Moreover, monetary policy has been tightened sharply in order to anchor inflation expectations and so prevent so-called second-round effects, those that emerge subsequent to the initial price increase.
In recent months, energy markets have given back some of the price gains and global supply chains have begun to reorganise, easing bottlenecks, and dampening the external shock that originally triggered the inflationary process. However, another bout of inflation, affecting food, continues to exert pressure, and core inflation remains high.
The goal of this paper is to analyse the conditions in which the ongoing counter-shock in energy prices can fully trickle through to other prices so as to unleash a period of sustained disinflation. To do so, we need to distinguish between, on the one hand, the effect of lower energy prices on headline inflation and, on the other hand, internal price and wage dynamics. Based on this analysis, we provide forecasts for the inflation trajectory in the coming years.
The external price shock and subsequent easing
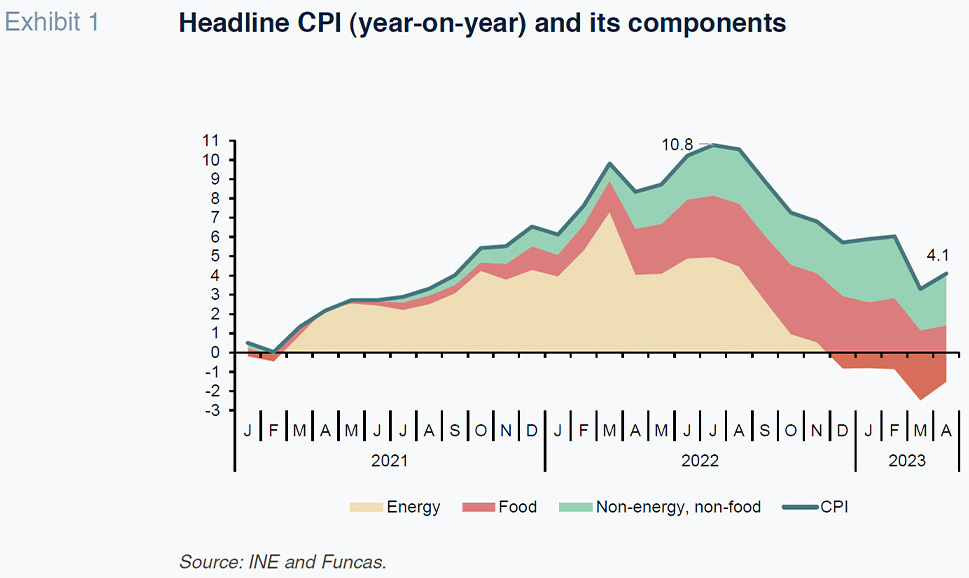
The tensions in the gas, electricity and, to a lesser degree, oil markets were exacerbated in the aftermath of the outbreak of war in Ukraine, boosting the energy component of CPI. The peak was reached in July 2022, with an energy CPI increase of 41.4%, year-on-year.
Since the summer, however, oil and gas prices have been trading at considerably lower levels and the futures markets point to stabilisation around current readings. On Mibgas, gas is currently trading at around €30, compared to over €160 in August, and forward prices for the next couple of years are relatively stable. Lower prices, coupled with the cap on the price of gas for electricity price determination purposes, have been accompanied by a sharp reduction in electricity bills. Oil prices, meanwhile, which had traded at close to $130/barrel (Brent) after the invasion of Ukraine, have also trended lower, to below $80 in both the spot and futures markets. Note, however, that overall energy prices remain considerably above pre-pandemic levels.
Nevertheless, recent price trends are translating into a notable reduction in energy CPI (-24% between the peak of July 2022 and April 2023), which has in turn led to a let-up in inflation in light of the significant weight of energy, both directly in headline CPI (the energy component represents 10% of the total) and indirectly, since energy is a key production input for all sectors (Exhibit 1). That indirect effect is, by its nature, necessarily gradual, as the pace at which cheaper energy gets passed through to other prices depends on the links comprising the various production chains.
As a result, industrial and agricultural production costs have begun to reflect the drop in the cost of energy and other imported inputs. The industrial producer price index, excluding energy, registered in April an annual growth of 4.2%, leaving behind the double-digit readings posted all of last year. In agriculture, the inflexion point was reached more recently due to the upward pressure on prices from other factors, including adverse weather and the drought affecting Spain. However, the data tracking the prices paid by farmers for fertilisers and other inputs point to a slight slowdown which, little by little, should start to curb food CPI (Ministry of Agriculture, Fishing and Food, 2023).
In short, the exogenous factors that were fuelling inflation have started to wane. There are bound to be ups and downs along the way due to the volatility characteristic of the energy and food markets and their vulnerability to global geopolitical tensions. However, assuming a scenario of no major additional surprises on the geopolitical front, it is likely that both energy and food will start to deflate CPI.
Onset of second-round effects
Thereby, price dynamics will henceforth depend on core inflation, and thus on internal factors, irrespective of the origin of the initial shock. In this respect, particular attention should be devoted to the dynamics of wages and corporate profits. This includes consideration of the recovery in purchasing power by wage-earners and the sectors hardest hit by the pandemic, which will inevitably keep exerting pressure on prices. Expectations are also key: empirical evidence shows that in a context of high inflation, the economic agents tend to set prices based on their outlook for cost increases, creating the risk of further eroding wage purchasing power and triggering a fresh round of inflation. The risk of a de-anchoring of expectations helps explain the ECB’s unwillingness to pause its interest rate increases despite the signs of economic weakness (Borio et al., 2023).
According to a number of indicators, core inflation, which excludes energy and unprocessed food, tends to be relatively persistent. In Spain, core inflation was still at 6.6% year-on-year in April. Stripping core inflation down further to exclude processed as well as unprocessed foods and energy, the resulting measure reveals high readings of 4.5%-5% since the start of the year. Similarly, the GDP deflator, the best proxy for internal inflation dynamics (albeit only available quarterly), increased by 6.2% in the first quarter, compared to an average of 0.8% during the period of growth that was truncated by the pandemic (average for 2014-2019).
[1]
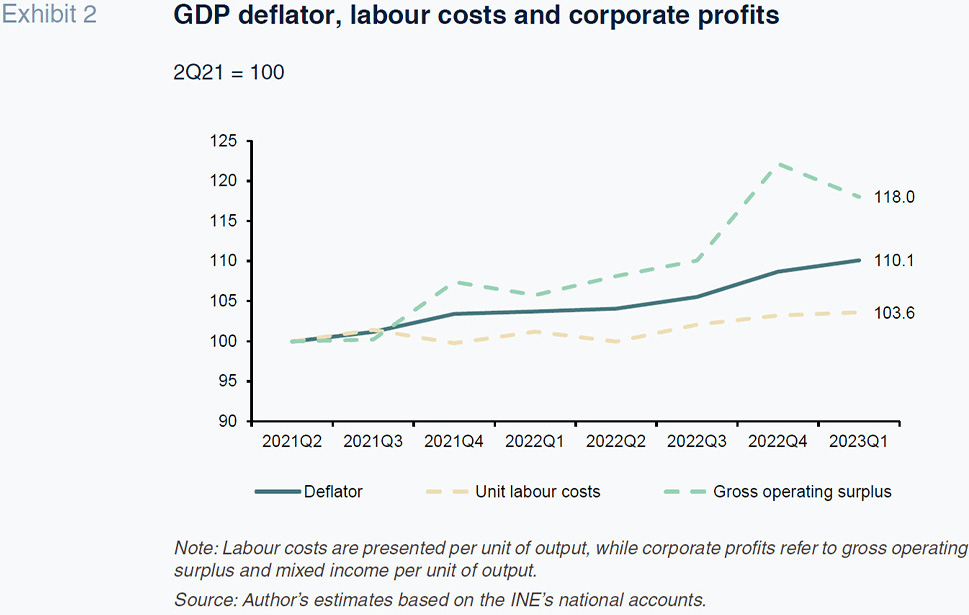
The GDP deflator is also the only indicator that enables a thorough assessment of how wages and corporate profits (the two main channels of internal inflation transmission) are contributing to price formation. Hence, its utility for the purposes of this paper. An analysis of both factors since the onset of the inflationary cycle yields two conclusions. Firstly, the increase in the GDP deflator (+10.1% between 2Q21 and 1Q23) is mostly attributable to the recovery in corporate earnings and to a much lesser degree to the increase in unit labour costs (Exhibit 2). Specifically, 73% of the inflation observed in terms of the GDP deflator between 2Q21 and 1Q23 is due to the gross operating surplus per unit of output; 17% is attributable to the growth in unit labour costs; and the remaining 10% is the result of taxes net of subsidies.
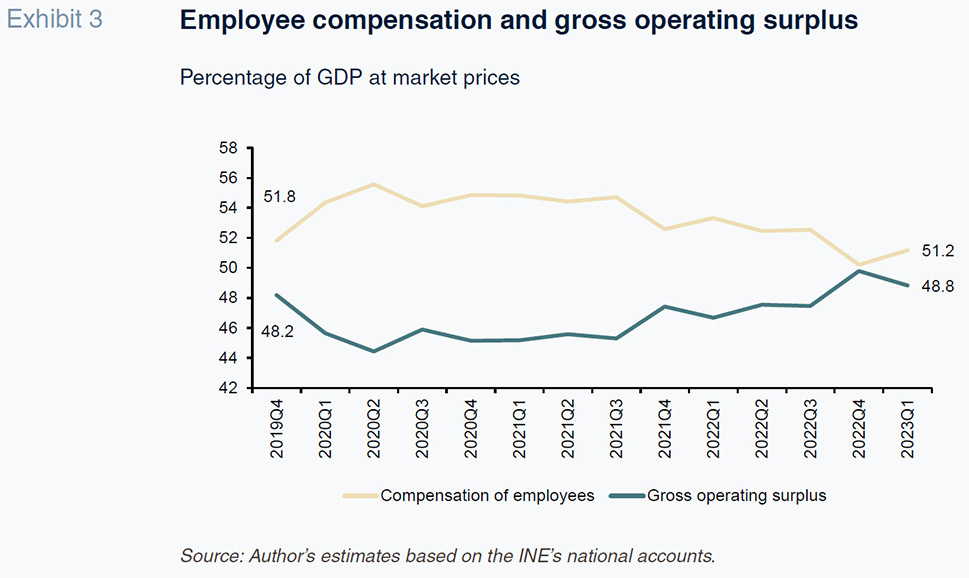
Secondly, the increase in corporate earnings is partially attributable to the post-pandemic. Corporate profits were badly hit by the lockdown, so that some of the growth observed in its wake reflects a catch-up process: following the sharp contraction recorded in 2020, the gross operating surplus as a share of gross value added at market prices embarked on a recovery path, only revisiting pre-pandemic levels by the last quarter of last year (Exhibit 3). In 1Q23, that metric was 0.6 percentage points above the level recorded in the last quarter of 2019. However, this general trend masks different sectoral realities. According to figures released by the tax authorities, profits have been particularly dynamic in the energy and wholesale sectors, while they have yet to revisit pre-pandemic levels in construction and some areas of manufacturing.
Outlook for inflation
Based on the above analysis, as well as two key assumptions, inflation estimates for the next three years can be inferred. The first assumption that underpins the projection relates to the stabilisation of energy and other imported input prices. In other words, we are assuming that there will be no new supply shocks, in either direction, so that inflation will depend fundamentally on internal price dynamics, in turn determined by labour costs and corporate profits. In statistical terms, this means that the CPI will move more or less in line with the GDP deflator (this being the pattern observed prior to the pandemic).
The second major assumption has to do with wage dynamics. Here we incorporate the recently concluded national agreement for collective bargaining, under which private sector wages are set to increase by at least 4% this year and a further 3% in both 2024 and 2025. Average compensation per wage-earner could rise by a little more than the threshold established for this year, in light of the planned increase in the minimum wage (while public sector pay may increase by less than the amount agreed for the private sector, this will not be enough to offset the impact of the increased minimum wage on the aggregate figure). Factoring in slight growth in labour factor productivity (0.5% per annum) yields growth in unit labour costs of 3.7% this year and of 2.5% in the following two years. Weighting those figures by the share of employee compensation in GDP we arrive at a contribution to the deflator of 1.9 points this year, 1.7 points in 2024 and 1.3 points in 2025 (see Table).
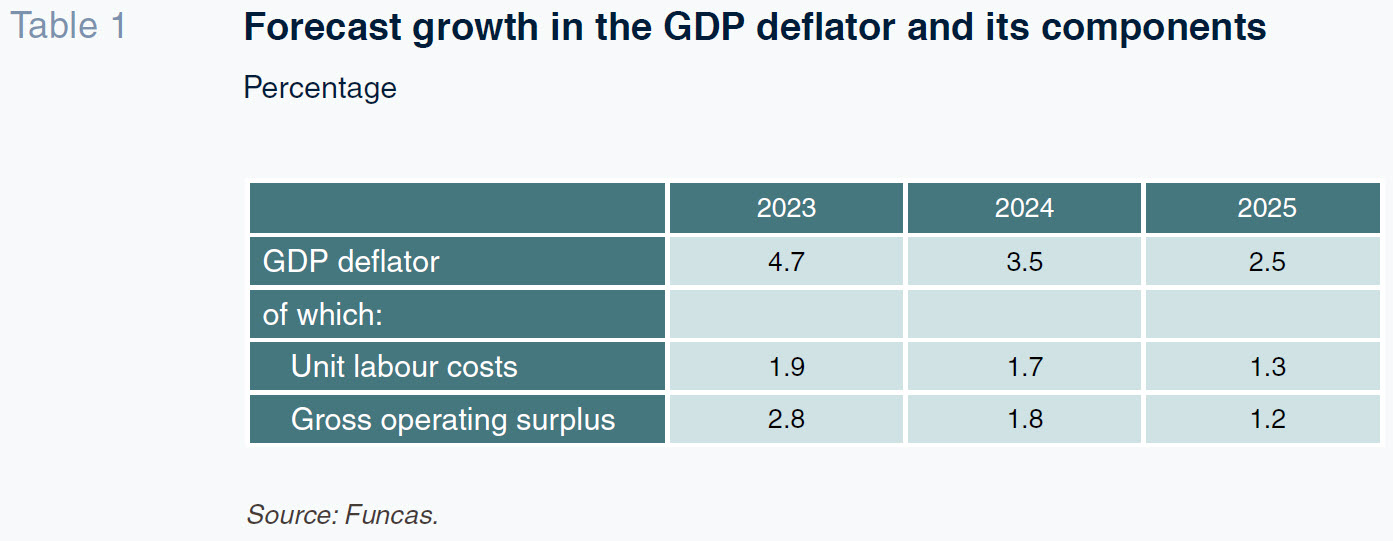
Starting from these assumptions, the path taken by inflation will depend on the trend in corporate margins. In our baseline scenario, we assume stabilisation in profits on aggregate around the levels observed in the first quarter of this year, given full recovery in profitability to pre-pandemic levels, as noted above. In addition, the current internal demand weakness leaves little space for businesses to hike sales prices beyond what can be justified by production costs. The operating surplus is still expected to contribute 2.8 points to the GDP deflator this year, as the 1Q23 figure was higher than last year’s average (see Table). In 2024 and 2025, the contribution by the operating surplus is estimated at 1.8 and 1.2 points, respectively, framed by our central assumption that corporate profits will stabilise.
Adding the contribution by employee compensation and operating surplus together yields GDP deflator forecasts of 4.7%, 3.5% and 2.5% for the next three years. Those forecasts, while still above the target of 2%, are relatively prudent, as they imply incomplete replenishment of the purchasing power lost since the onset of the current bout of inflation. In other words, we are contemplating second-round effects in wage terms. The slowdown in corporate profit growth is also a relatively sanguine assumption, as it implies breaking the ongoing upward trend.
For inflation to return rapidly to 2%, in a context marked by the wage agreement, corporate profits would have to fall substantially from first-quarter levels. That has never happened in the Spanish economy for as long as there are records except during episodes of recession: over the past four decades, the economy’s gross operating surplus per unit of output only contracted in the recession of the early 90s, during the financial crisis and in 2020.
Conclusions
The disinflation process facilitated by the let-up in energy prices will be gradual. Except in the unexpected advent of a recession or a sharp correction in imported prices, it is unlikely that core inflation will return to its target level of 2% before the end of 2024. Moreover, disinflation could be slower in other eurozone economies closer to full employment, so that it is unlikely that a return to the pre-inflation expansionary stance of monetary policy happens any time soon. Interest rates could begin to ease in tandem with disinflation as from next year, a development that would help contain financial costs, especially for households with borrowings at floating rates of interest (Torres, 2023). There are no signs, however, of a return to the era of quantitative easing.
Notes
One has to go as far back as the 1990s to find a similar increase in the GDP deflator.
[2]
This estimate is in line with Mojon, Nodaro and Siviero (2023).
References
BORIO, C., LOMBARDI, M. J., YETMAN, J. and ZAKRAJšEK, E. (2023). The two-regime view of inflation. BIS Papers, March.
https://www.bis.org/publ/bppdf/bispap133.htm MOJON, B., NODARO, G. and SIVIERO, S. (2023). Disinflation milestones.
BIS Bulletin, No. 75, May.
https://www.bis.org/publ/bisbull75.htmSPANISH MINISTRY OF AGRICULTURE, FISHING AND FOOD. (2023). Índices y precios pagados agrarios. [Agricultural prices paid and indices],
https://www.mapa.gob.es/es/estadistica/temas/estadisticas-agrarias/preciospagados
agrariospublicacion2023enero_tcm30-650545.pdf TORRES, R. (2023). Increases in Euribor and potential impact on mortgages and the Spanish economy.
Spanish Economic and Financial Outlook (SEFO), Vol. 12, No. 2, March 2023.
https://www.funcas.es/wp-content/uploads/2023/03/Sefo-12-2-Raymond.pdf TORRES, R. and FERNÁNDEZ, M. J. (2022). Outlook for the Spanish economy in light of rising in inflation. Spanish Economic and Financial Outlook (SEFO), Vol. 11, No. 1, January 2022.
https://www.funcas.es/wp-content/uploads/2022/01/01-Raymond-Torres_111.pdf
Raymond Torres. Director for Macroeconomic and International Analysis, Funcas