Impact of inflation in Spain in 2021 and 2022: Which households have been the hardest hit?
The intensity and persistence of the recent bout of post-pandemic inflation is causing a set of undesirable consequences for Spanish households. However, the headline figures mask an even more worrying reality – that the current inflationary phenomenon has had proportionately more severe consequences for less well-off households.
Abstract: In the wake of the crisis generated by the pandemic, worry over inflation is once again dominating the economic debate. On the social front, the intensity and persistence of this bout of inflation is causing a raft of undesired collateral effects for households: sharp erosion of real income; higher costs for staple products; higher mortgage servicing costs and difficulties in setting aside savings. All these problems have intensified in the last two years, with the consumer price index (CPI) jumping from 3.1% in 2021 to 8.4% in 2022. However, the headline figures mask far bigger price increases in a broad spectrum of basic goods and services. For example, electricity costs surged 35.6% higher in 2021, while olive oil prices shot up by 26.1% in 2022. Using the micro-level basket of goods and services included in the Spanish Household Budget Survey (SHBS), this paper calculates a price index by household for 2021 and 2022. On average, the results clearly show that the post-pandemic inflationary phenomenon has hurt less well-off households proportionately more, particularly those in the first three income deciles. In other words, the households that spend roughly 14,000 euros per annum (around 1,200 euros per month). The regions most affected have been Castile-La Mancha, Castile-León, Extremadura, Galicia, La Rioja and Aragón, which between them represent the bulk of unpopulated or so-called ‘empty Spain’. The households located in the smallest towns, with fewer than 10,000 inhabitants, have been affected the most, particularly those over 65 living alone.
Constructing a price index for each household (Household CPI)
The CPI synthesises into a single figure the change in the prices of the various items comprising the average basket of household goods and services. Due to the way it is calculated, it lacks a sufficient level of abstraction as it provides an average figure for the impact of prices on resident households. Behind that aggregate provided regularly by the National Statistics Office (INE), there is an underlying CPI for each household whose value depends on the relative composition of its respective basket of goods and services. In other words, each household has its own CPI, which for simplicity we will term the HCPI.
That index is shaped by the interaction of two variables: (i) the movement in the prices of goods and services; and (ii) the weight of each item in their baskets.
The HCPI estimated in this paper uses statistics taken from two different INE sources. For prices, it uses the annual nationwide CPI data broken down by subclass. For the structure of household spending, we used the most recent Spanish Household Budget Survey (SHBS) available, which relates to 2021. The SHBS is a representative sample providing socioeconomic information for around 20,000 households. The level of disaggregation is greater in prices than expenditure. As a result, we had to perform an ad-hoc allocation for items of expenditure that do not have a specific price using the closest price criterion.
To calculate the weight of the various goods in the shopping basket we excluded two expenditure items included in the SHBS. Specifically: (i) imputed rent; and (ii) remittances to other non-resident members.
[1] Imputed rent is an estimate of the rental price homeowners would have to pay if they were tenants in their own homes – the average value is high in Spain on account of the significant weight of home ownership.
[2] Unlike real rents, however, imputed rents do not reflect the exchange of money between parties. Remittances to other members are unilateral transfers for which it is not possible to determine their destination. Hereinafter, we will term the sum of the various goods and services covered by the SHBS, excluding these two items, “Adjusted Household Expenditure”.
The estimated HCPI values by level of spending power and socioeconomic indicators make it possible to identify which classes of households have been hit the hardest by the prevailing inflation. Moreover, a comparison between the distribution of the average HCPI and headline CPI allows us to calculate the percentage of households relatively more affected by the rise in prices. Specifically, a given household’s HCPI may be above, below or equal to CPI depending on its spending structure. As we will see below, households whose expenditure is concentrated more intensely around goods that have been more affected by the current inflation will present HCPI readings that are above headline CPI. If the opposite is true, their HCPI will be below the headline index.
Prices and spending structures
Table 1 provides the year-on-year rates of inflation for 2021 and 2022 grouped into 20 categories whose prices increased by 3.1% and 8.4% on average, respectively. It also provides the average weight represented by those groups of goods in Adjusted Household Expenditure in the SHBS for 2021. As for the average baskets of goods and services, the information provided in Table 1 shows that food and non-alcoholic beverages account for the highest share of spending by Spanish households, at 24.8%. That category is followed, by a wide margin, by expenditure on restaurants and hotels, at 8.3%, and on energy (electricity, natural gas and liquefied gas), at 7.0%. After those items, household expenditure is scattered across a significant number of categories accounting for between 4% and 6% of total spending, covering a wide variety of needs such as clothing, rent, home maintenance, communication, recreation and culture and vehicle fuels. Lastly, the goods with the smallest weights in the average basket of goods and services are personal care (3.9%), alcoholic beverages and tobacco (2.3%), education (1.3%), public transport (0.7%) and senior and dependent care (0.2%).
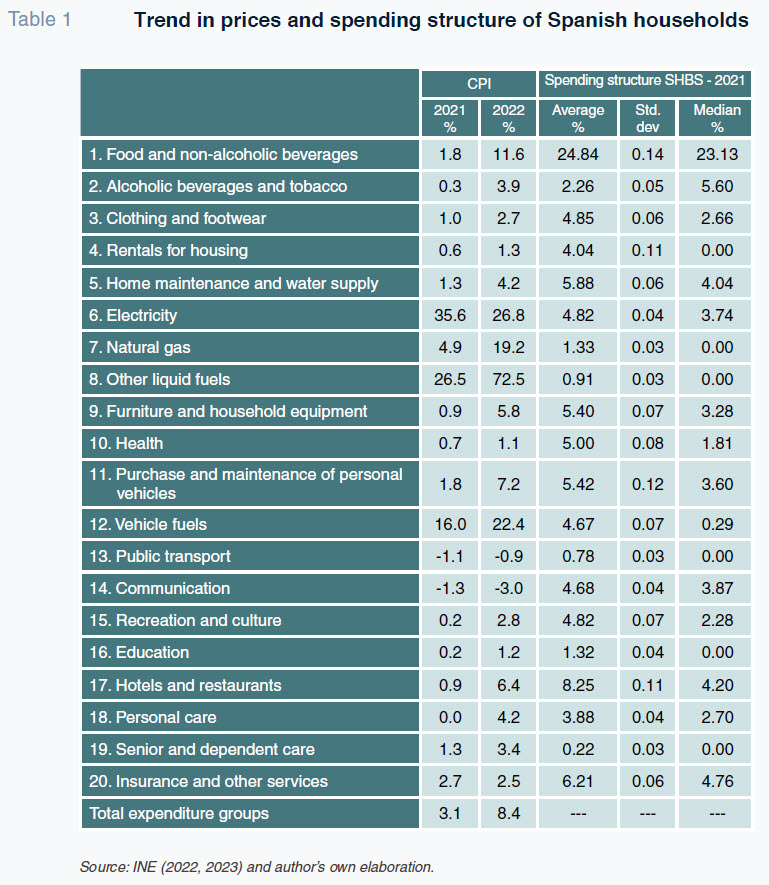
Behind the headline inflation of 3.1% in 2021 lie far bigger increases in certain goods. Specifically, the goods and services most affected by the inflation that year were energy goods and services, with electricity costs jumping a noteworthy 35.6%, and the price of liquid fuels rising 26.5%. In 2021, the price of food increased by just 1.8% on average. Inflation intensified in 2022, climbing to 8.4%, with energy the category most affected by the rampant inflation once again. Growth in electricity prices eased to 26.8%, but growth in natural gas prices accelerated from 4.9% to 19.2%, while liquid fuel prices soared 72.5% higher. Vehicle fuel prices registered growth of 22.4%, followed by price growth of 11.6% in food products, 7.2% in personal vehicles and their repair and 6.4% in restaurants and hotels. It is worth singling out the growth observed in food prices throughout 2022. Of the 55 food price headings calculated by the INE, 17%, including milk, eggs and olive oil, registered growth of between 20% and 30%; 41%, including meat, bread, legumes, potatoes and fresh fruit, registered growth of between 10% and 20%, with the remaining 42% sustaining price growth of less than 10%.
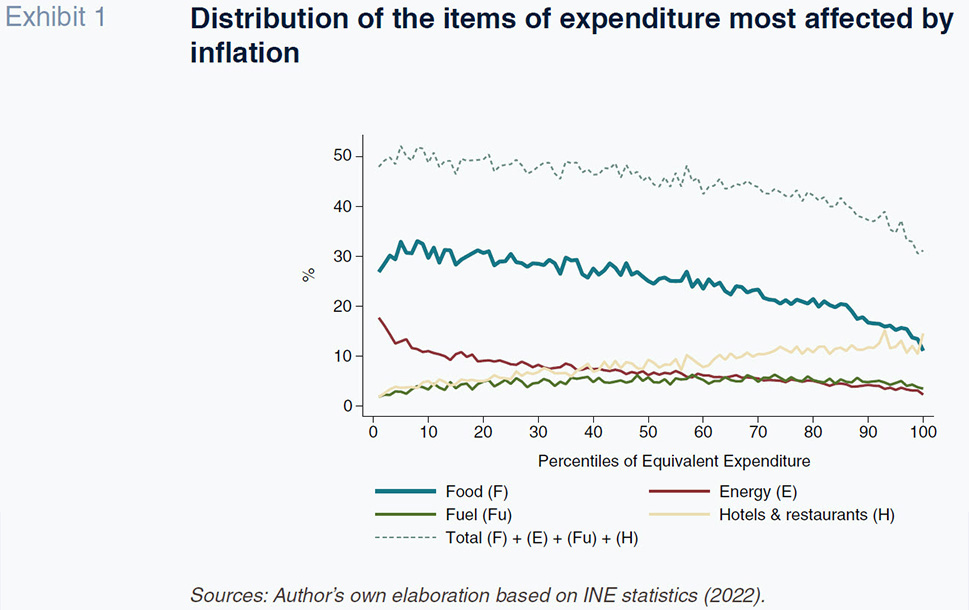
In short, Table 1 shows how the inflation sustained in 2021 and 2022 affected the goods with the highest weight in Spanish households’ shopping baskets: food, energy, fuel, restaurants and hotels. Exhibit 1 depicts the relative weight of those four expenditure groups in household spending. Those weights have been charted by percentile of Household Equivalent Expenditure for which Adjusted Household Expenditure has been reweighted to reflect household size and composition. To do that, we use the OECD’s equivalence scale which assigns a value of 1 to the breadwinner, 0.7 to other household members over the age of 13 and 0.5 to members under the age of 13. The results show that the share of expenditure accounted for by food is a decreasing function of equivalent expenditure, accounting for roughly 30% of the total in the first three deciles and less than 16% in the last decile. The decreasing share pattern is also observed in energy, with weights of over 10% in the first decile, compared to less than 5% in the last decile. Overall, Exhibit 1 shows that the aggregate share of these four expenditure groups clearly decreases as a function of the level of equivalent expenditure. As a result, as we will see next, the intense inflation sustained in 2021 and 2022 has hit the households with less spending power.
Impact of inflation by level of household expenditure
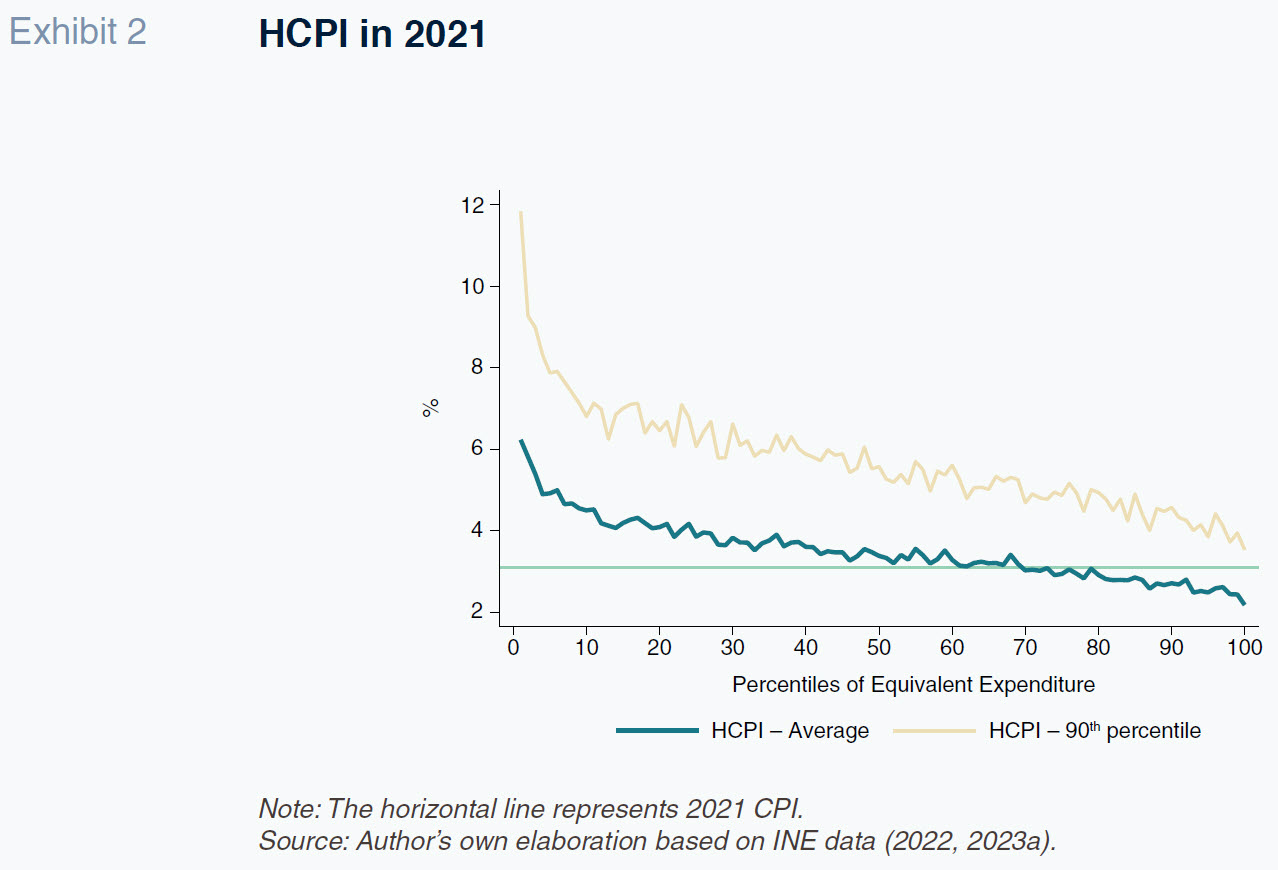
Exhibits 2 and 3 show the average HCPI by percentile of equivalent expenditure in 2021 and 2022. For illustration, the exhibit also includes the 90th percentile of the distribution. As foreshadowed above, HCPI decreases as a function of equivalent expenditure in both years. In 2021, the first seven deciles bore a rate of HCPI above the headline rate of 3.1%. The differences are far more pronounced in the first three deciles, at 5.0%, 4.2% and 3.9% in the first, second and third deciles, respectively. In contrast, the average HCPI is below CPI for the upper 30% of households. We can therefore talk about a 70/30 split to synthesise the percentage of households that sustained rates of HCPI that were higher/lower than headline inflation in 2021. That 70% includes households with adjusted annual expenditure of up to 26,900 euros. A comparison of the HCPI values at either end of the distribution is useful in looking at the differences in impact of inflation on households furthest apart in terms of spending power. Specifically, average HCPI in the first decile, which includes the 10% of households with the least spending power, is 5.1%. That is 1.6 times headline CPI of 3.1%. In contrast, average HCPI in the bottom decile, which encompasses the 10% of households with the highest spending power, is 2.5%, equivalent to 80% of CPI. In other words, average HCPI in the first decile is twice that of the last decile.
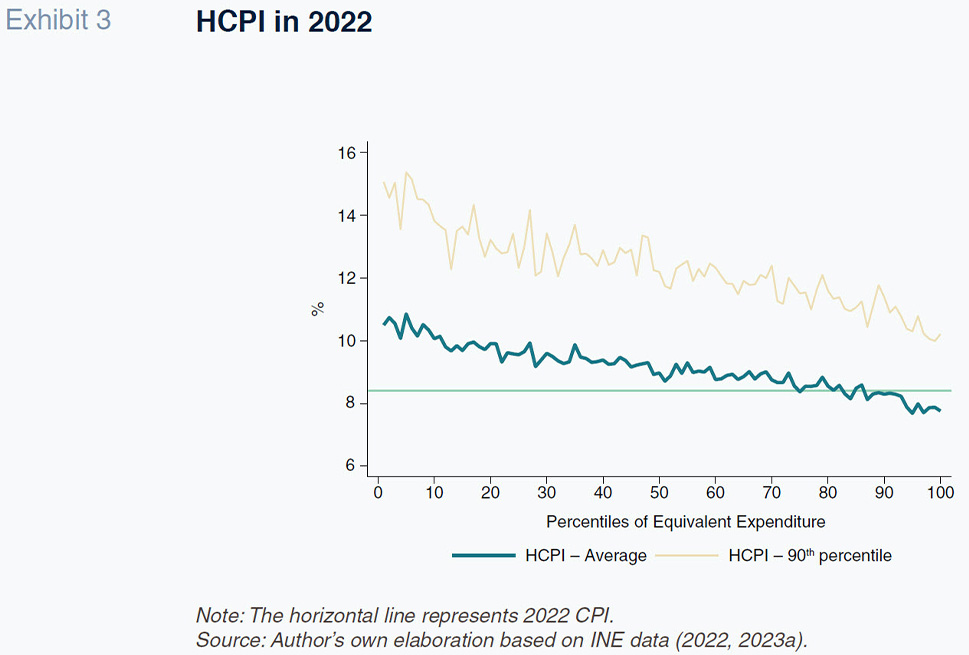
In terms of the impact in 2022, the 70/30 split observed in 2021 changes to 80/20. That means that in 2022, the percentage of households that on average sustained a rate of HCPI above headline inflation increased by 10 points, so that the threshold for being in that situation increased from 26,900 euros of adjusted annual expenditure to 32,500 euros. The differences in the intensity of the impact among the first deciles decreased slightly in 2022 by comparison with 2021. Specifically, the distance between the first and third deciles narrowed from 1.3 points in 2021 to 0.9 points in 2022. All in all, the information provided in Exhibits 2 and 3 confirms that the sharp growth in prices in 2021 and 2022 disproportionately affected the households with lower spending power. To illustrate this, the 90th percentile distribution shows that in some households the incidence was much higher than indicated by the average. For those households, the HCPI for the first decile was 8.48% in 2021 and 10.41% in 2022, which is 5.3 points and 2.0 points above the CPI readings, respectively.
Impact of inflation by region and socioeconomic category
Table 2 shows HCPI for 2021 and 2022 by Spanish region. Both sets of results have been ranked in descending order by 2022 HCPI. For comparative purposes, the table includes the regional ranking of households by income levels gleaned from the Living Conditions Survey (INE, 2023b) in which the Basque region is at the top. It also provides the equivalent household size (UC1); Ceuta has the largest equivalent household size (2.43 members) and Asturias, the smallest (1.9). Lastly, we provide the share of the shopping basket accounted for by spending on food, energy and fuels and by the aggregate of all three items. The inflation impact rankings follow similar patterns in 2021 and 2022 so we focus the analysis below on the 2022 results.
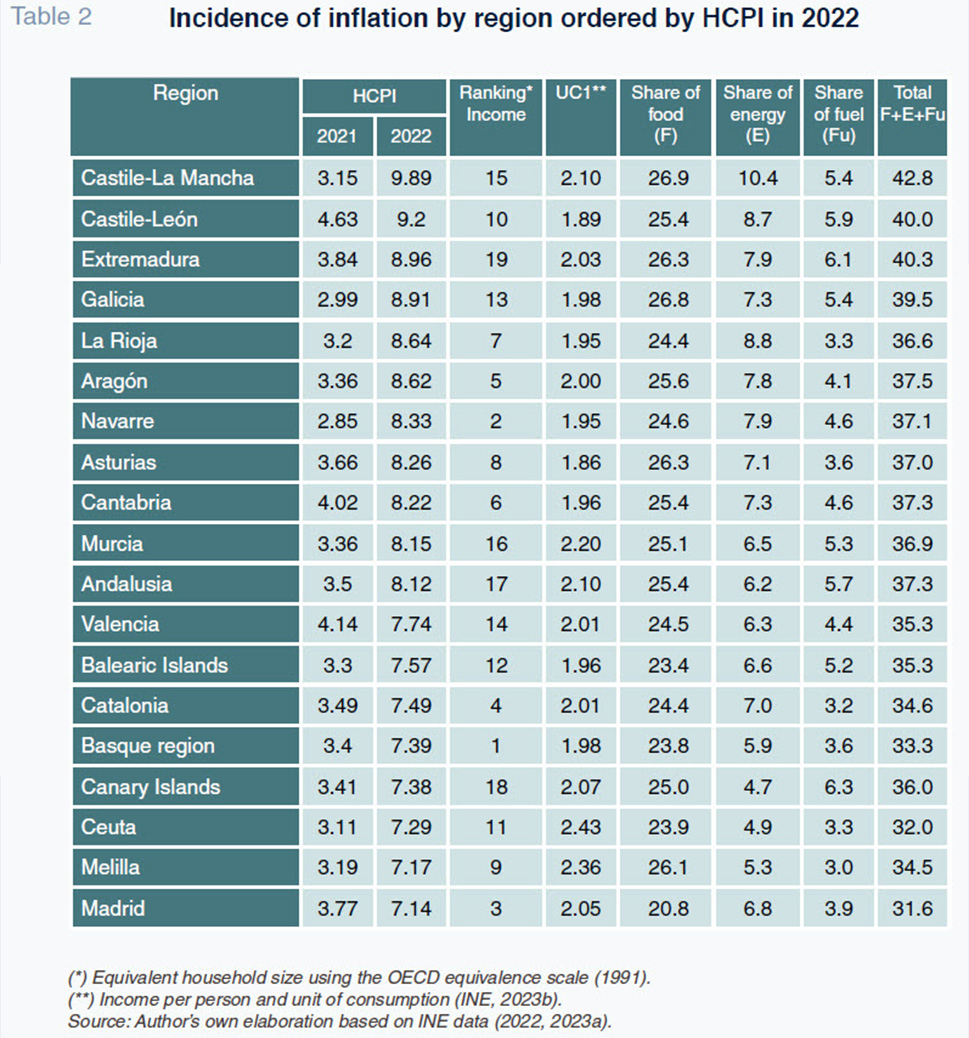
The six regions presenting HCPIs above CPI in 2022 were Castile-La Mancha, Castile-León, Extremadura, Galicia, La Rioja and Aragón, in that order. They are home to the majority of Spanish provinces that comprise what is known as depopulated or empty Spain (Bandrés and Azón, 2021). In these regions, the average share of the shopping basket accounted for by food, energy and fuel is above the national average. Castile-La Mancha, the Spanish region with the highest HCPI reading in 2022, also earmarks the highest shares of total expenditure to food (26.9%) and energy (10.4%). In population terms, all six regions share two noteworthy characteristics. Firstly, their population density is below the national average (94.1 inhabitants/km2) and that metric is below 30 inhabitants/km2 in Castile-La Mancha, Castile-León, Aragón and Extremadura. Secondly, with the exception of Castile-La Mancha, the level of population ageing is above the national average (INE, 2023c). Specifically, the ratio of seniors over the age of 65 to minors under the age of 15 is 1.5 in Aragón, La Rioja and Extremadura and 2.1 in Castile-León, compared to a national average of 1.3.
High population dispersion coupled with the existence of a small number of large towns, where most of the provision of public and private goods and services tends to take place, would explain the high share of fuel expenditure in Castile-La Mancha, Castile-León and Extremadura. Elsewhere, the different variants of the (more extreme) continental climate that affect Castile-La Mancha, Castile-León, Extremadura and Rioja explain the high share of spending on energy. At the opposite end of the spectrum, the six regions with the lowest HCPI readings were Madrid, Melilla, Ceuta, the Canary Islands, the Basque region and Catalonia. They have in common shares of expenditure on food, energy and fuels that are below the national average. In Madrid, the Basque region and Catalonia, that is attributable to proportionately lower spending on food, with Madrid presenting the lowest share, at 20.8%. In Ceuta, Melilla and the Canary Islands, it is due to lower relative spending on energy and fuel, offsetting their higher spending on food.
The interplay of geographic location and climate conditions and household expenditure levels provides insight into the differences in the incidence of inflation observed from one region to the next. More specifically, geographic locations determine the amount of energy used by households via two factors: the annual number of hours of sunshine received, which shapes lighting requirements, and climate conditions, which affect the use of heating and air conditioning devices (INE, 2020).
[3] There are significant differences in these two factors across the Spanish territory. For example, the number of hours of sunshine enjoyed along the Cantabrian coast is approximately 1,800 per annum, compared to around 3,000 hours in the south. Meanwhile, winter temperatures in the central regions are among the lowest in Spain, affecting spending on heating.
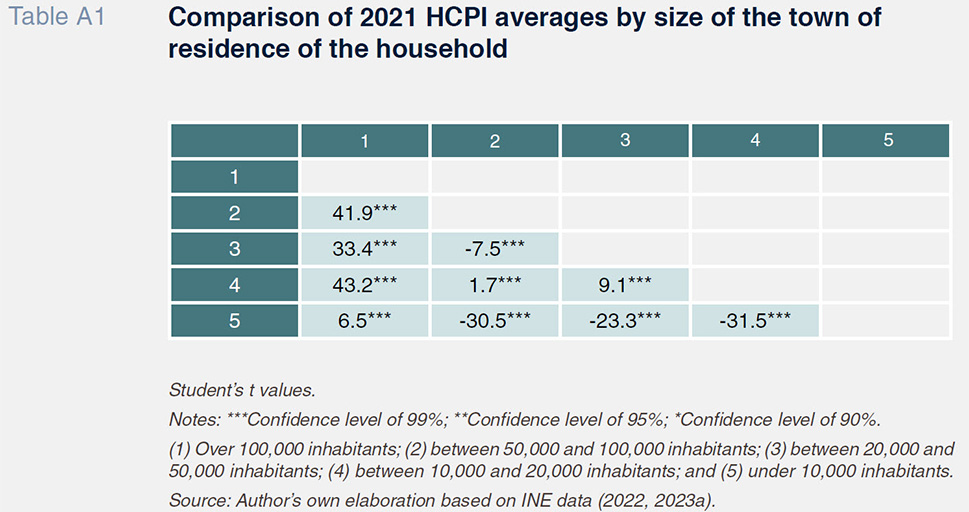
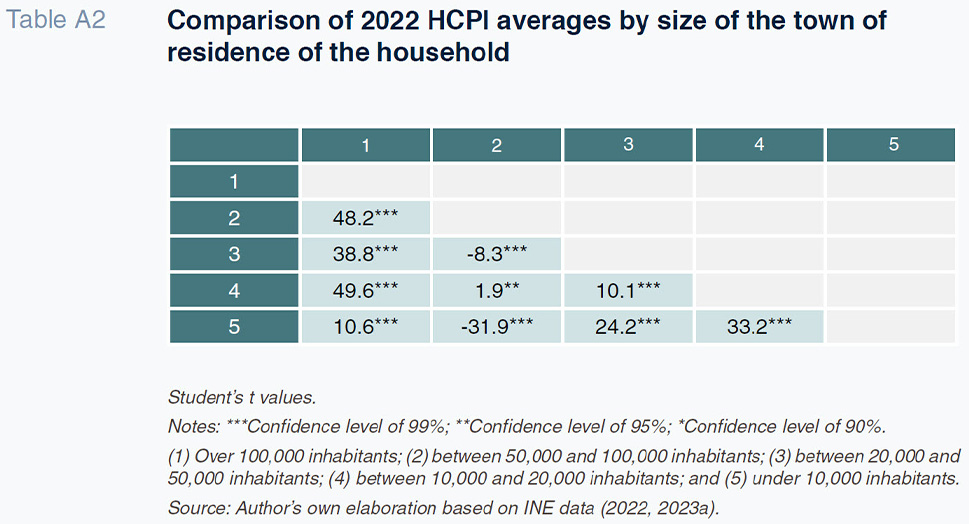
Table 3 provides HCPI readings by geographic location of the households alongside a selection of socioeconomic variables. The results show that inflation is being felt more keenly in small towns with fewer than 10,000 inhabitants. Note that small towns represent 73.7% of Spain’s 8,131 municipalities. The average difference in HCPI between larger towns (with a population of more than 100,000 inhabitants) and smaller towns (with fewer than 10,000) was 1.9 points in 2021 and 3.4 points in 2022. Between 2021 and 2022, the HCPI increased more in small towns than in large towns, increasing 5.4 points in the former and 4.0 points in the latter. By way of example, the Appendix shows that the differences in the averages as a function of the size of the towns where the households reside are statistically significant.
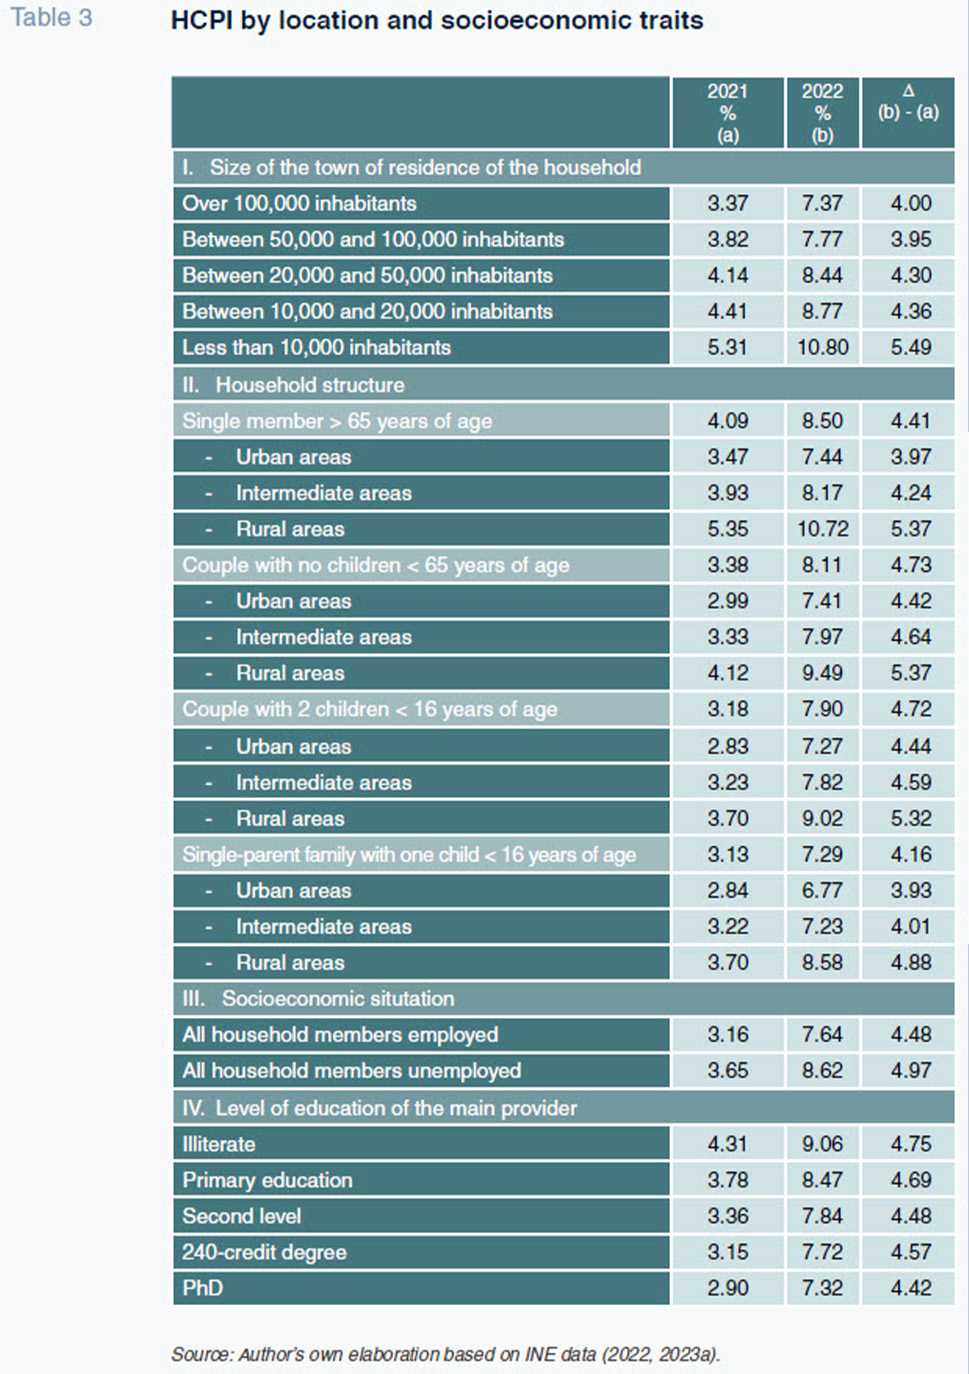
Inflation also has different impacts depending on household structure. Those made up of just one person over the age of 65 bear higher average HCPI readings than those made up of young couples (with or without children) and than single-parent households. A common pattern across all household structures is the fact that HCPI levels are clearly higher for households living in rural areas. Consider the case of seniors over the age of 65, where the HCPI readings vary between 7.44 for residents in urban areas and 10.72 for those living in rural areas, i.e., a difference of 3.28 points. As we saw in the last section, households with less spending power are suffering higher HCPI levels. That outcome is borne out for households in which all members are unemployed and those with lower levels of education (used as a proxy for income).
Notes
This procedure coincides with the methodology used by the INE.
The average value was 7,665 euros in 2021, equivalent to an average of 28% of total expenditure by households that own their homes; 88% of the SHBS households had imputed rent in 2021.
According to the Institute for Energy Diversification and Savings (IDAE, 2011), heating accounts for 47% of spending on energy on average, while lighting and air conditioning represent 4% and 1%, respectively.
References
Desiderio Romero-Jordán. Universidad Rey Juan Carlos and Funcas
Appendix