
Impact of inflation on the VAT burden for Spanish households in 2021 and 2022
Value added tax (VAT) receipts soared in 2021 and 2022, by 14.9% and 13.4%, respectively, according to the Spanish tax authority (AEAT, 2023). An analysis of the increase in the VAT borne by households those years and how much of the increase is attributable exclusively to the inflation phenomenon shows that Spanish households’ total VAT burden increased by 263.6 euros on average in 2022, of which 138.2 euros (52.4%) is directly attributable to inflation.
Abstract: Value added tax (VAT) receipts soared in 2021 and 2022, by 14.9% and 13.4%, respectively, according to the Spanish tax authority (AEAT, 2023). This dynamic was buoyed by the tailwind provided by rampant inflation, which jumped from 3.1% in 2021 to 8.4% in 2022. An analysis of the increase in the VAT borne by households those years and how much of the increase is attributable exclusively to the inflation phenomenon shows that Spanish households’ total VAT burden increased by 263.6 euros on average in 2022, of which 138.2 euros (52.4%) is directly attributable to inflation. The VAT burden accumulated between 2021 and 2022 exclusively as a result of inflationary pressures averaged 297 euros. That sum increases to approximately 350 euros for a standard household with a level of spending similar to average household income in Spain in 2022 (32,200 euros).
Methodology used to calculate the VAT receipts induced by inflation
The proxy used for the total VAT borne by households is expressed as follows:

where Sit is spending on goods and services in year t (net of indirect taxes and the change in prices during that period), HCPI is the specific consumer price index for each household and tit* is its weighted average VAT tax rate. The VAT borne by each household can be broken into two components:
(i) “Pure” VAT receipts, or VAT net of inflation: Rpit=Sit∙tit*
(ii) The revenue induced by the increase in prices: Riit=Sit∙HCPIit∙tit*
To estimate the breakdown of total VAT receipts by each of these two components, Rp and Ri, we need to have the S, t* and HCPI values for each household. Those variables were calculated using micro data taken from the Spanish Household Budget Survey (SHBS) for 2021 and 2022 (INE, 2022, 2023). The SHBS is a representative survey with socio-economic information for around 24,000 households resident in Spain. It is an ideal survey for our purposes and certainly the only one that lends itself to estimating the VAT borne by households in fine detail. Nevertheless, surveys of this nature present two shortcomings which need to be underlined: (i) underreporting of certain classes of expenditure, such as alcohol, beer and tobacco; and, (ii) limited representativeness of households at the tail ends of the distribution curve. The SHBS only includes current spending and therefore does not encompass investments in real assets such as housing, commercial premises, or land. As a result, any comparison between the VAT revenue figures estimated on the basis of the SHBS and those provided by the tax authority (and of the resulting average rates) should be read with caution.
The calculation of the VAT borne by Spanish households and its disaggregation between pure VAT and inflation-induced revenue requires first analysing the impact of inflation on each of the households in the survey. The consumer price index (CPI) published by Spain’s statistics office, the INE, provides information about the average amount of price growth sustained by all Spanish households. However, as outlined in detail in Romero-Jordán (2023a), each household has its own price index (HCPI), the level of which is the result of the interaction between two factors. Firstly, it is the result of the specific composition of each household’s shopping basket, which can vary significantly as a result of variables such as income levels, household structure or geographic location. Secondly, it depends on the change in prices, in each period, in the items comprising that specific shopping basket. We will return to this matter further on.
Structure of tax bases, average rates and HCPI
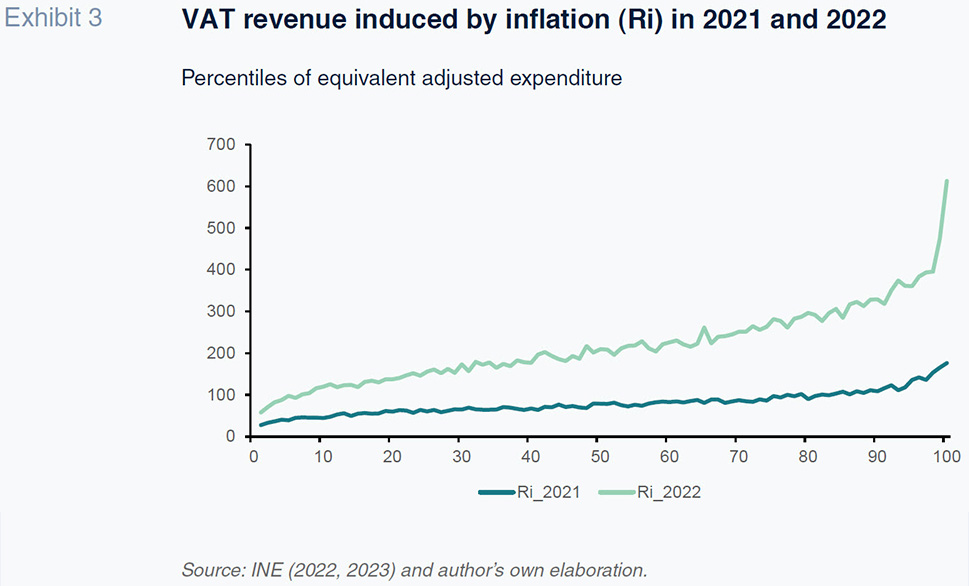
As shown in Table 1, consumption patterns changed suddenly in 2020 as a result of the lockdown, with the share of goods carrying the super-reduced VAT rate sustaining extraordinary growth (2.52 points). The items carrying the super-reduced rate are largely food staples, including bread, milk, eggs, fruit, and fresh vegetables. 2021 marked the start of a gradual transition back to pre-pandemic patterns: the share of the items carrying the super-reduced rate dropped somewhat (by 0.92 points on average), while those carrying the reduced and the standard rate increased (by 0.7 and 0.21 points, respectively). [1] The energy crisis of 2022 slowed the return to pre-pandemic circumstances, once again reducing the share of items carrying the standard rate of VAT by 0.32 points. In short, the period between 2019 and 2022 was characterised by growth in the share of goods carrying the super-reduced rate (6.51%) and reduced rate (0.55%), offset by a drop in the share commanded by goods carrying the standard rate of 2%. As a result of that change of mix, the weighted average VAT rate decreased from 15.04% in 2019 to 14.87% in 2022. It will take a few years to ascertain more accurately: (i) whether these changes in spending patterns prove temporary; (ii) their impact on the weighted average VAT rate; and, (iii) their impact on tax collection as reduced inflationary pressures slow growth in VAT receipts.
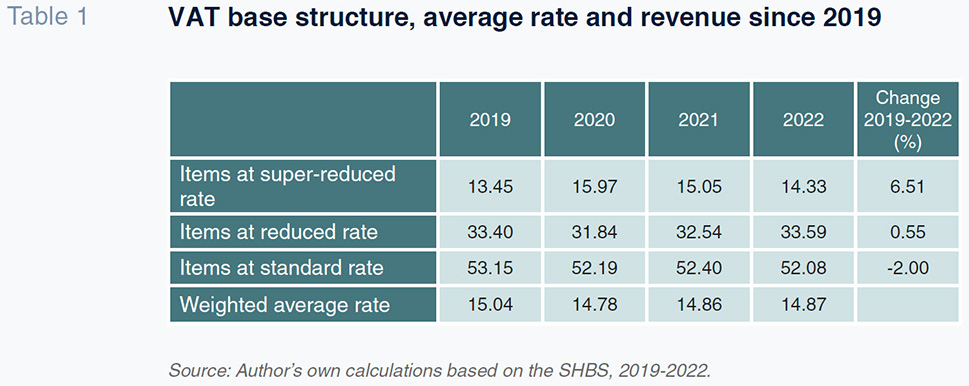
Exhibit 1 provides the distribution of the average rate by percentile of adjusted expenditure and yields two conclusions. Firstly, there are no apparent relevant differences in the breakdown of the average rate between 2021 and 2022. Secondly, except for the first five percentiles, in Spain, the average rate of VAT is progressive in relation to household spending.
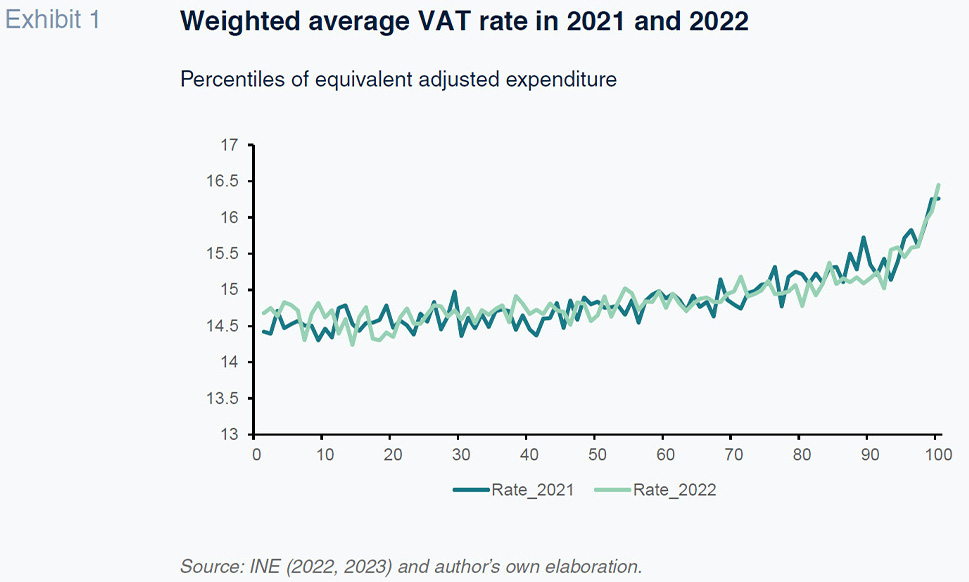
As for inflation, CPI averaged 3.1% in 2021 and 8.4% in 2022. Following the methodology outlined in Romero-Jordán (2023a), Exhibit 2 shows the HCPI for each percentile of equivalent adjusted expenditure borne by each household in each of 2021 and 2022. It shows how the households affected the most by inflation were those with lowest purchasing power. The explanation is simple: food and energy, two of the components commanding the highest shares of those households’ expenditure in 2021 and 2022 were among the most affected by price growth. Exhibit 2 also shows how the percentage of households with an above-average HCPI was 70% in 2021, rising to 80% in 2022. In other words, in relative terms, the percentage of households affected to a greater degree by the growth in prices increased in 2022 (for further details, refer to Romero-Jordán, 2023a).
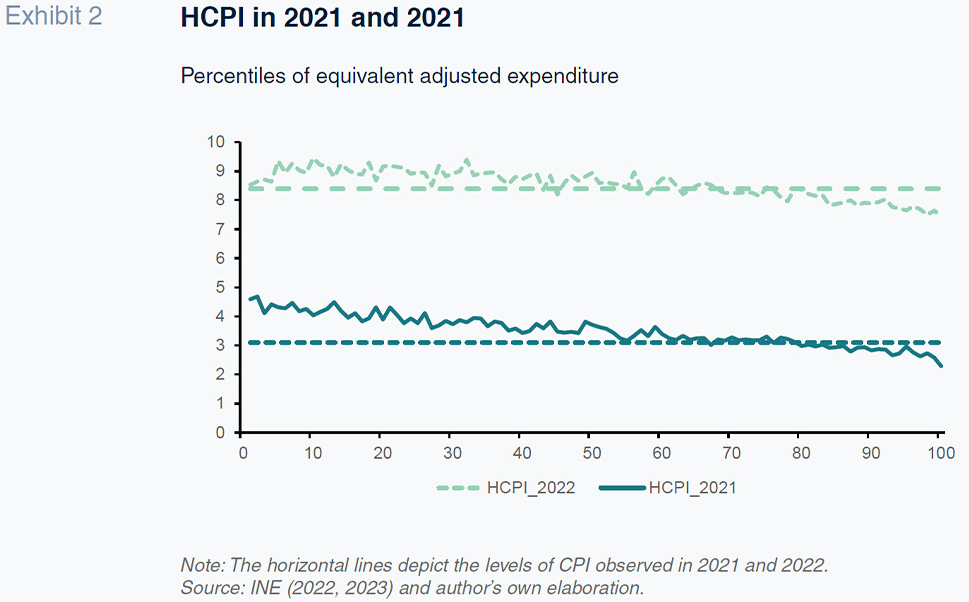
On average, inflation induced 79.4 euros of additional VAT in 2021 and 217.6 euros in 2022 (Exhibit 3). Moreover, households above the 30th percentile of equivalent adjusted expenditure bore over 150 euros of VAT in 2022 as a result of inflation. In 2021, on the other hand, only the households in the last five percentiles breached that threshold.
Absolute and relative impact of inflation on VAT revenue in 2021 and 2022
As shown in Table 2, the VAT burden averaged 2,592 euros in 2021 and 2,855 euros in 2022, an increase of 263.6 euros on average. There are significant differences depending on the level of household expenditure, however. Those situated in the first decile, whose average adjusted expenditure amounted to 6,070.6 euros, bore 671.3 euros of VAT in 2022, annual growth of 45.2 euros. Note that this decile includes households that spend an average of 500 euros a month. Meanwhile, those encompassed by the last decile, whose average adjusted expenditure tops 62,500 euros, bore 7,256.2 euros of VAT in 2022, annual growth of 490.5 euros. Between the first and last deciles, therefore, the difference in VAT borne in 2022 amounted to around 450 euros. The figures imply an increase of close to 400 euros for a standard household with adjusted expenditure similar to average income in Spain in 2022 (32,300 euros). In relative terms, the average growth in VAT revenue was 10.2% in 2022, with the peak recorded in the households included in the sixth decile (12.5%). Albeit not strictly comparable, that growth of 10.2% is slightly lower, although in line, with the increase of 13.4% indicated in the statistics compiled by the tax authority (AEAT, 2023) for total VAT receipts.
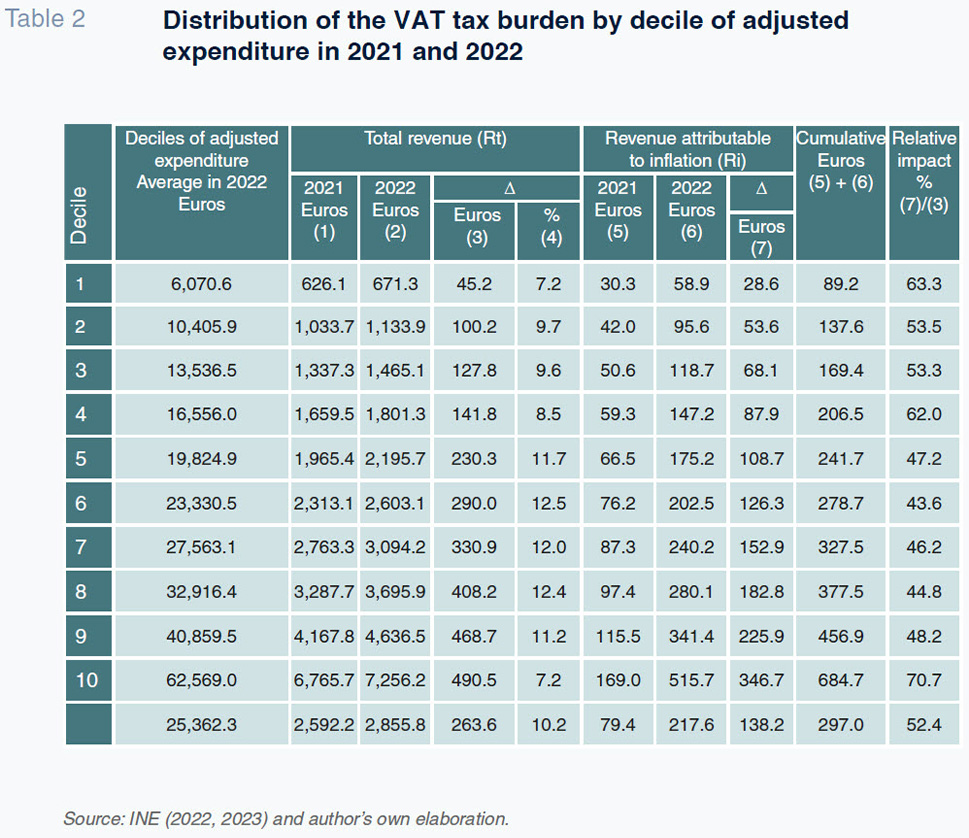
The average VAT burden generated specifically by the impact of inflation (Ri) was 79.4 euros in 2021, ranging between 30.3 euros in the first decile and 169 euros in the last decile. In 2022, the average increased to 217.6 euros, coming in at 58.9 euros for the 10% of households that spent the least and 515.7 euros for the 10% that spent the most. By comparison, the average VAT burden induced by inflation was 2.74 times higher in 2022 than in 2021. As noted above, the average rate of VAT barely changed between 2022 and 2021 despite the fact that inflation was nearly three times higher in 2022 and adjusted expenditure increased by 10.3%.
[2] In cumulative terms, between 2021 and 2022, the increase in the tax burden attributable exclusively to inflation averaged 297.0 euros per household. That tax bill ranged between 89.2 euros in the first decile and 684.7 euros in the last one. The cumulative increase for a standard household with adjusted expenditure similar to average income in Spain in 2022 was close to 350 euros.
[3]
The VAT induced by inflation increased by an average of 138.2 euros between 2021 and 2022. That increase is greater the higher the level of adjusted household expenditure: from 28.6 euros in the first decile to 346.7 euros in the last decile. The last column in Table 2 shows that, on average, 52.4% of the increase in revenue in 2022 was shaped by the impact of inflation, which is slightly lower, albeit in line, with the 60.6% estimated by AIReF (2022) for total VAT revenue. This value helps understand the extraordinary growth in VAT revenue in 2022, which was amplified by the highly favourable inflation tailwind. [4] On average, of the 263.4 euro increase in the VAT borne by Spanish households in 2022, 138.2 euros was the direct result of inflation.
Cumulative VAT attributable to inflation by region and socio-economic category in 2021 and 2022
By region, Table 3 provides the average VAT burden attributable to inflation. The data provided refer to the cumulative impact between 2021 and 2022. The regions have been ordered from highest to lowest VAT burden. Table 4 replicates the calculations by the size of the municipality where the households reside and household structure, the level of education of the breadwinner and relative spending levels. By region, the highest cumulative incremental tax burden was borne in Navarre, at 341.8 euros; this region ranks highest in adjusted expenditure and also presents slightly above-average cumulative growth in HCPI (12.4% versus 12.1%). At the other end of the spectrum lies the Canary Islands which presents the lowest cumulative additional revenue value (240.7 euros), ranks second-to-last in adjusted expenditure, and reports considerably below-average price growth (10.9% versus 12.1%). The cumulative incremental VAT induced by inflation is higher in households living in smaller-sized municipalities. This pattern of a more pronounced impact on households in rural areas holds irrespective of the age of the breadwinner (over or under the age of 65) or the fact of having minors living in the household. At any rate, the differences between each of the categories of households are very small. For example, in households over the age of 65, the difference between those living in urban versus rural areas is less than 25 euros on average (169.1 euros versus 147.6 euros).
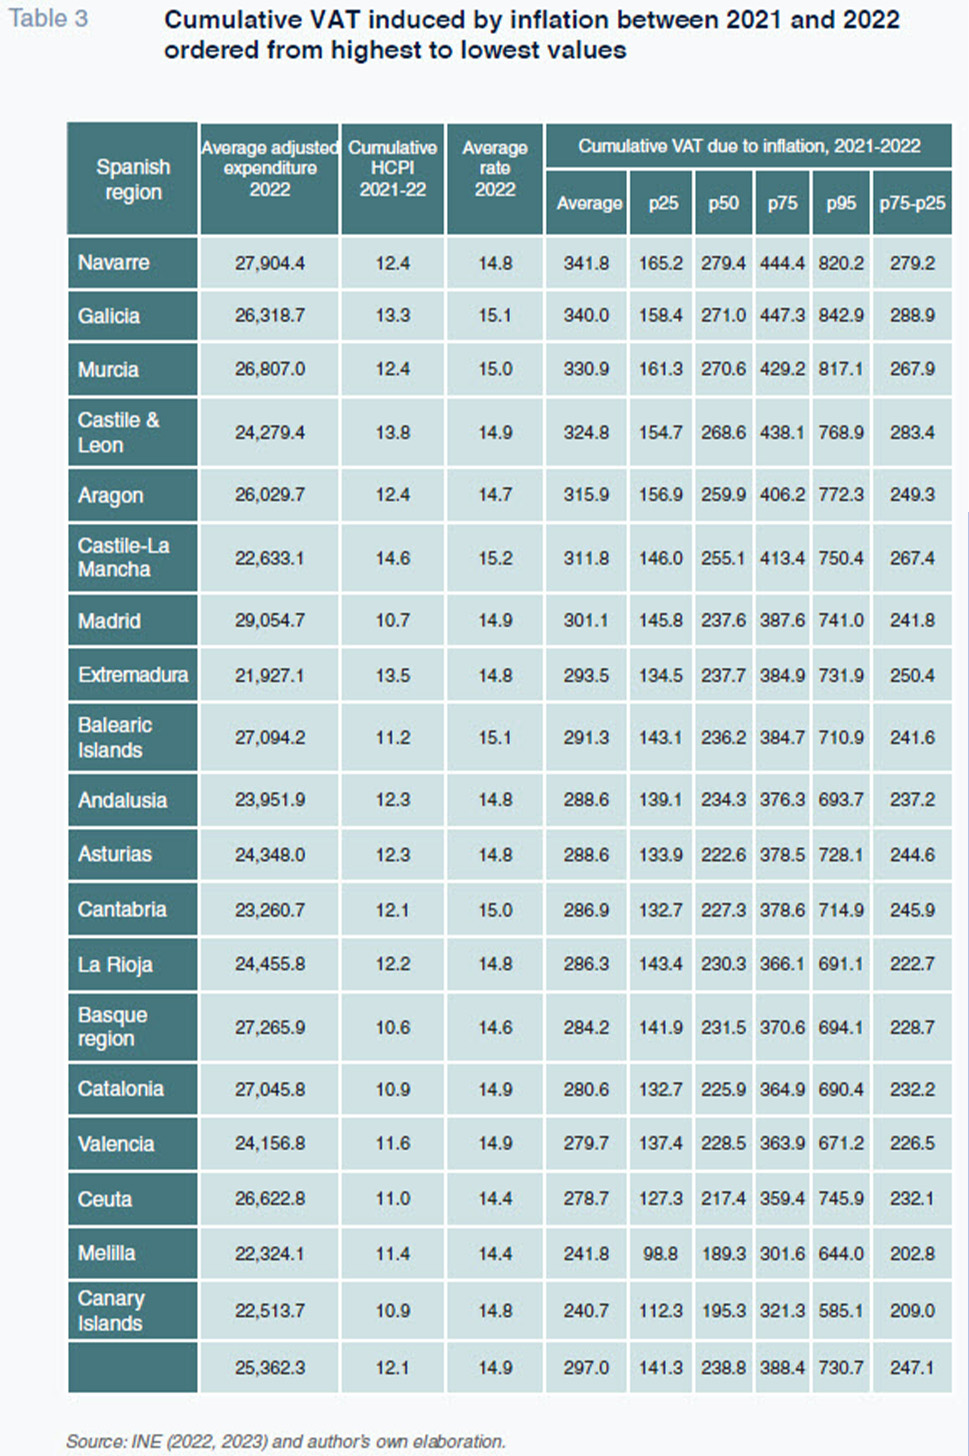
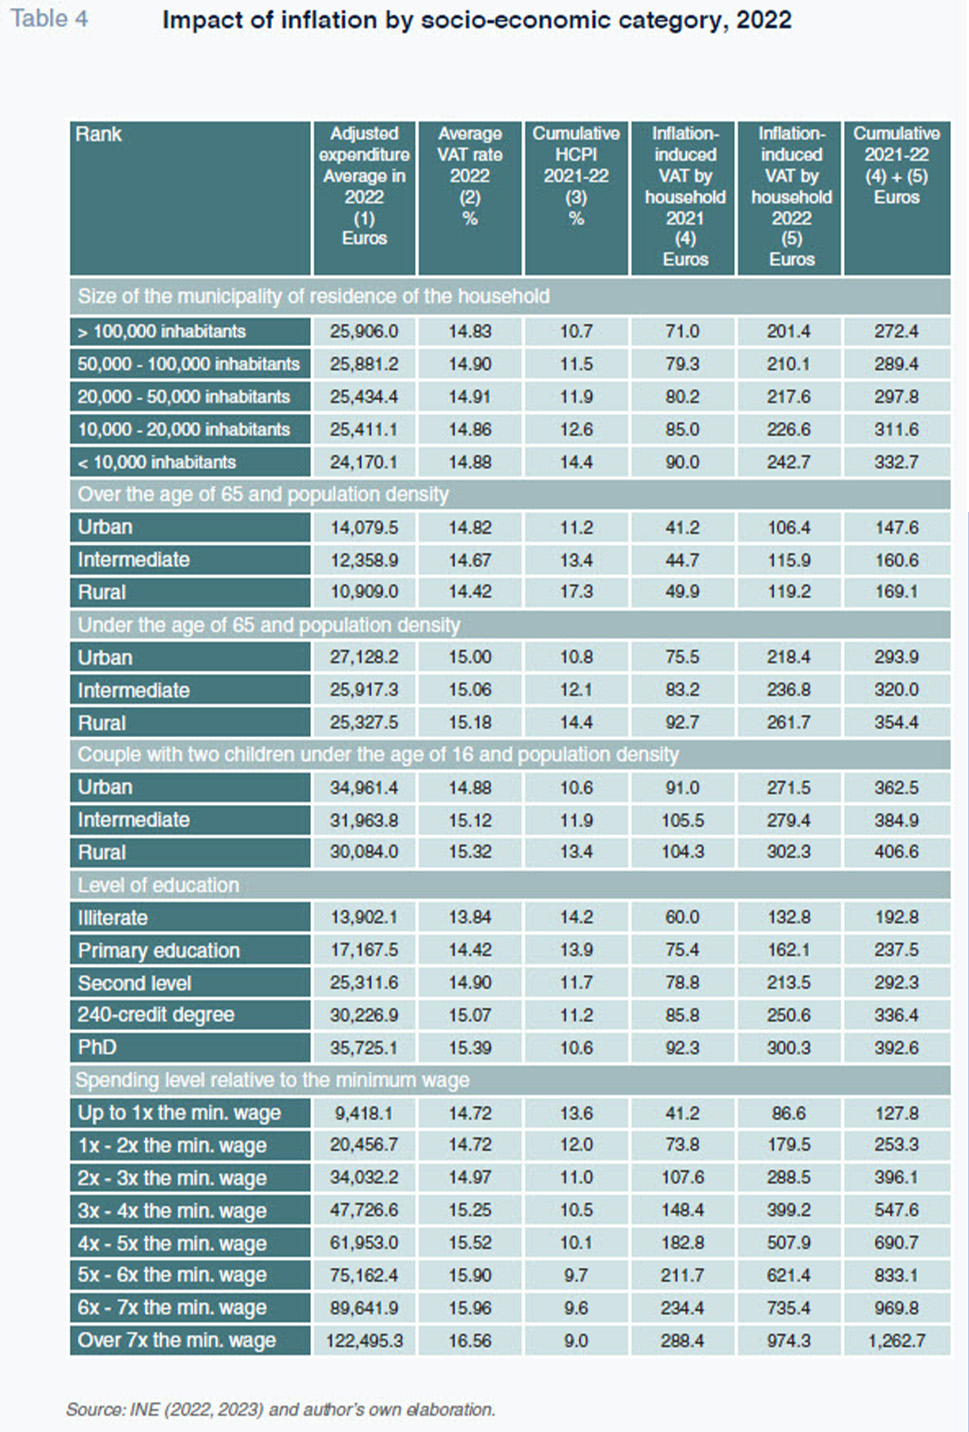
The cumulative impact on VAT increases in line with the level of education of the breadwinner, used as a proxy for household financial wherewithal. The cumulative average is close to 400 euros for households where the breadwinner holds a PhD and under 240 euros in households without the equivalent of primary schooling. Lastly, we provide calculations for the VAT borne for different levels of spending relative to the minimum wage in force in 2023 (currently 15,120 euros per annum). The data confirm that the cumulative inflation impact is an increasing function of expenditure, ranging from 127.8 euros on average for households that spend less than 15,120 euros per annum to 1,262.7 euros for households whose average annual exceeds 105,000 euros.
Notes
Among other items, meat, fish, all processed foods, public transportation, and water carry the reduced rate. All services, including energy services, are also taxed at the reduced rate.
That increase in adjusted expenditure is lower, although in line, with the 15.0% growth in final spending subject to VAT gleaned from the tax authority’s statistics (AEAT, 2023).
The reduction in the rate of VAT on food in effect since 2023 is expected to reduce households’ average tax bill by around 100 euros per annum (Romero-Jordán, 2023b). That tax relief is roughly equivalent to one-third of the cumulative additional VAT burden induced by inflation.
By way of comparison, according to the tax authority (AEAT, 2023), VAT receipts increased by 1.9% with CPI at 0.7% versus, for example, revenue growth of 13.9% in 2022 with headline inflation at 8.4%.
References
Desiderio Romero-Jordán. Rey Juan Carlos University and Funcas