
Euro yield curve evolution and real long-term rates
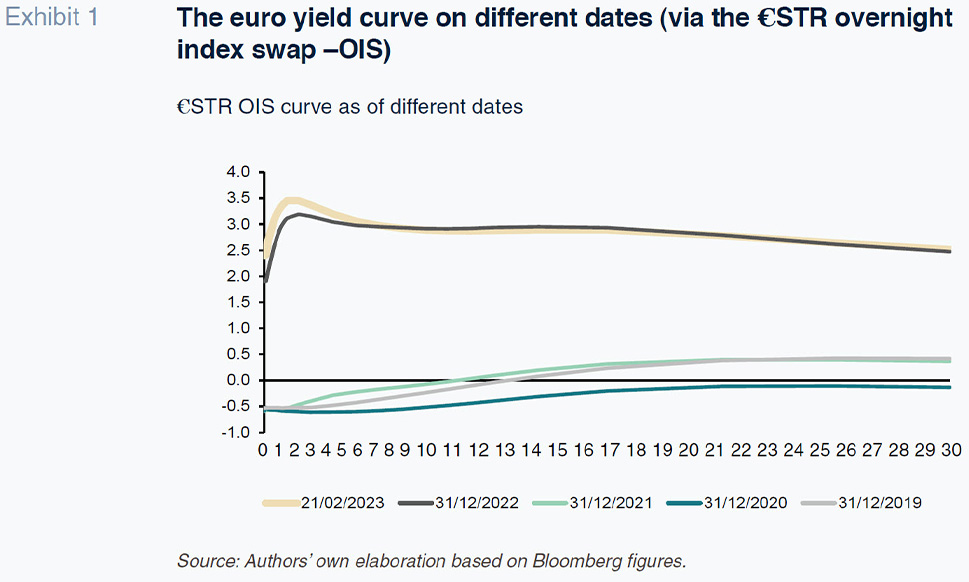
Assessing the recent evolution of euro interest rates reveals that following the significant upward shift in short-term rates since the summer of 2021, long-term rates may have already stabilised at restrictive levels. Under this scenario, as short-term rates keep increasing, longer-term rates could gradually stabilise, generating a downward sloping yield curve.
Abstract: Long-term interest rates are a function of three major factors: real interest rates, the structure of supply and demand, taking into consideration the central bank’s balance sheet, and long-term inflation expectations. Thus, based on the information provided by the nominal yield curves (spot and forward rates), inflation expectations, gleaned from the market and surveys, and estimated real rates, we assess the new interest rate levels etched out in the eurozone. Our results show that there is a possibility that following the significant upward shift in short-term rates observed since the summer of 2021, long-term rates may have stabilised in real terms such that, going forward, the curve will pivot around them. Under this scenario, as short-term rates keep increasing, the stabilisation of longer-term rates could generate a downward sloping yield curve.
Introduction
In early 2022, Germany’s 10-year Federal bonds abandoned negative territory for the first time in over three years. One year on, the yield on those bonds is trading at 2.5%. Day after day the papers and social media are full of news about the rise in the eurozone’s benchmark monetary policy rates but they rarely stop to analyse the profound change that is taking place in real interest rates along the so-called yield curves, which map out the relationship between rates and their tenors in a specific market at any point in time, their meaning and the implicit message they are sending about where they are headed.
Long-term rates, the curve and implied rates
Yield curves move over time changing their slope, following a fairly predictable pattern according to the empirical evidence. When rates are high or restrictive, the curve slope tends to be negative, discounting future cuts in the short-term rates controlled by the central banks. When rates are low or expansionary, the slope tends to be positive, pricing in rate increases in the future. In other words, long-term rates are “averages” of implicit or discounted future rates. Looking at the shift in the euro curve between 2013 and 2023, we observe an exceptional period during which the curve has only turned negative of late, as short-term rates have moved into restrictive territory.
Are the forward rates implied by the yield curve therefore the rates the market expects to materialise? That is the big question financial literature has been trying to resolve. Here we limit our analysis to presenting the implied rates and interpreting them as the future rates discounted by the market at a given point in time, reminding the reader that those rates do not necessarily “only” reflect expectations. Expectations do not always have a “free rein” over the curve: the market participants –issuers, buyers, sellers– have to take decisions framed by regulations, management styles and structural changes in supply and demand over the long-term.
It is beyond the scope of this paper to perform an empirical analysis of the recent data but it is safe to say that bond purchasing by the central banks since 2008 appears to have impacted rates in the middle and long ends of the yield curves. Eurozone monetary policy has used non-traditional instruments since the onset of the Global Financial Crisis in 2007-2008, with its balance sheet becoming a mirror for the complex forces that have shaped liquidity management –massive liquidity injections– and yield curve formation (quantitative easing or QE), long-term rates being more and more focused, as noted by Gulati and Smith (2022).
As a result, it is probable long-term rates included a negative premium during the QE period, partially reversed since its end (Exhibit 2). The ECB itself has acknowledged that the phenomenon has affected the bond markets (traded public debt) far more than the interest rate swap markets.
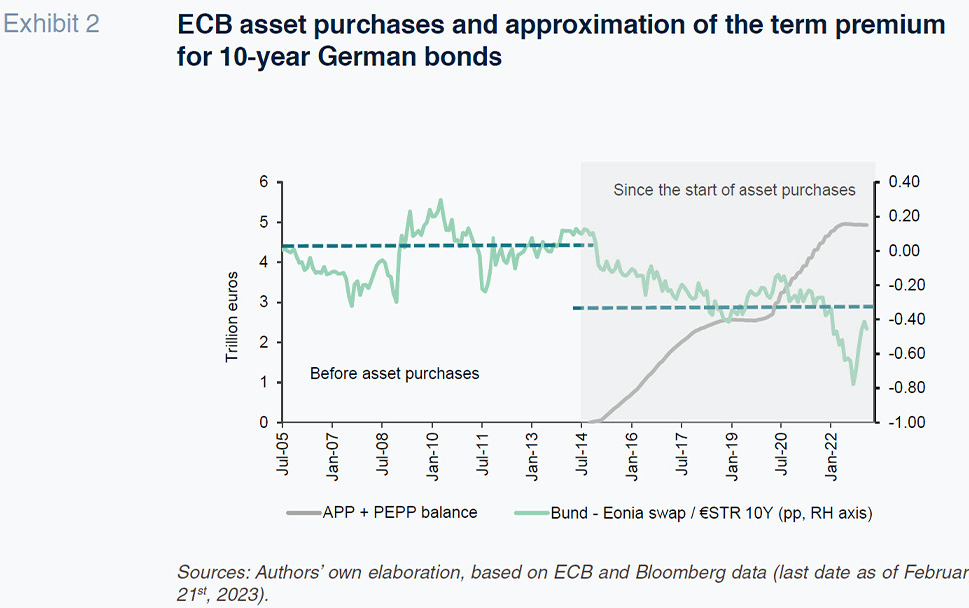
Rapid reduction of its balance sheet by not reinvesting principle repaid and/or heavily selling off debt holdings would help “normalise” that distortion and lift long-term rates (for given expectations for the outlook for short-term rates) but would unleash a series of consequences, affecting sovereign bond risk premiums in the euro debt market, for example, that are not currently desirable for or desired by the central bank.
Real long-term rates and the natural rate of interest, r*
Long-term interest rates reveal the paths short-term rates are expected to follow but they can also be approached as the result of adding expected annual inflation over the time horizon analysed and a premium for real interest. Breaking long-term rates down into those two components helps understand their level by sparking an important element of the monetary policy debate: that of comparing the real rate with the natural (or equilibrium) rate.
To do that, we need to look not at real past inflation but rather the “expected” inflation priced in by the markets (the compensation demanded by bondholders, captured, for example, using the breakeven inflation rates for bonds indexed to that variable) or forecast at specific points of time by economic agents as gleaned from surveys. The difference between the nominal rate of interest at a given maturity and those measurements of future inflation yield the real rate of interest comparable with the corresponding natural rate.
Expected long-term inflation
In a context such as this of abrupt swings in relative prices and high volatility in observed and traded inflation –the main input for forming inflation expectations–, it is particularly hard to estimate the level of inflation that really is expected to prevail in the long-term because the transitory component of observed inflation is currently so high. That is why there is so much volatility and uncertainty. The current high levels of inflation are a global phenomenon, shaped partly by sector-specific (or supply side) factors and partly by demand factors. On the supply side it is worth highlighting the energy, commodity and fresh food price shocks derived from the war in Ukraine and sanctions against Russia. Supply chain friction is another relevant albeit waning factor. As for the demand factors, the sharp recovery in the consumption of services related with the resumption of mobility and tourism and the sudden growth in spending, fuelled by the savings pent up during the years of restrictions, are the main sources of inflationary pressure.
Other important factors in the formation of expectations include the expected effectiveness of monetary policy and the central bank’s credibility in terms of formulating a symmetric target –2% in the case of both the Fed and the ECB–, the independence of the central bank and the evidence of its persistence in fighting inflation in prior episodes. Labour market dynamics, competition, other economic policies and the international context are equally important aspects.
The crisis of 2008 gave way to the Great Recession. As already noted, during those years the central banks had to tackle deflationary pressures. That affected long-term inflation expectations, which dipped below 2%, alerting of the possible decoupling of expectations for that variable over that time horizon. It is worth recalling, however, that before that long recessionary period, which unquestionably kept inflation low, the global economy went through the Great Moderation, which started in the mid-1980s and generated a credit bubble that burst in 2007, a period of growth but also of moderate inflation in which other deflationary factors, such as technological change, globalisation and the decline in workers’ bargaining power, came into play (Schnabel, 2022).
What are current expectations for inflation in the long term? The answer can be found in the following.
- Market agent surveys, specifically of professional economic forecasters (the SPF, published quarterly by the ECB), point to medium-term inflation slightly above the ECB’s target of 2%. Those forecasts therefore do not foreshadow decoupling of inflation expectations. The responses provided by the forecasters surveyed regarding the probability associated with the various scenarios reveal a shift in the right-hand tale of the inflation distribution over the past two years.
- Elsewhere, the compensation for inflation traded in the zero-coupon inflation swaps market (from 1 to 10 years) allows us to etch out the annual inflation path (each year) over that time horizon. The path discounted today points to inflation easing towards 2.5%-2.6% within 2-3 years, with inflation remaining at around 2.45% in the medium- and long-term, in other words, above the ECB’s target of 2% at all times.
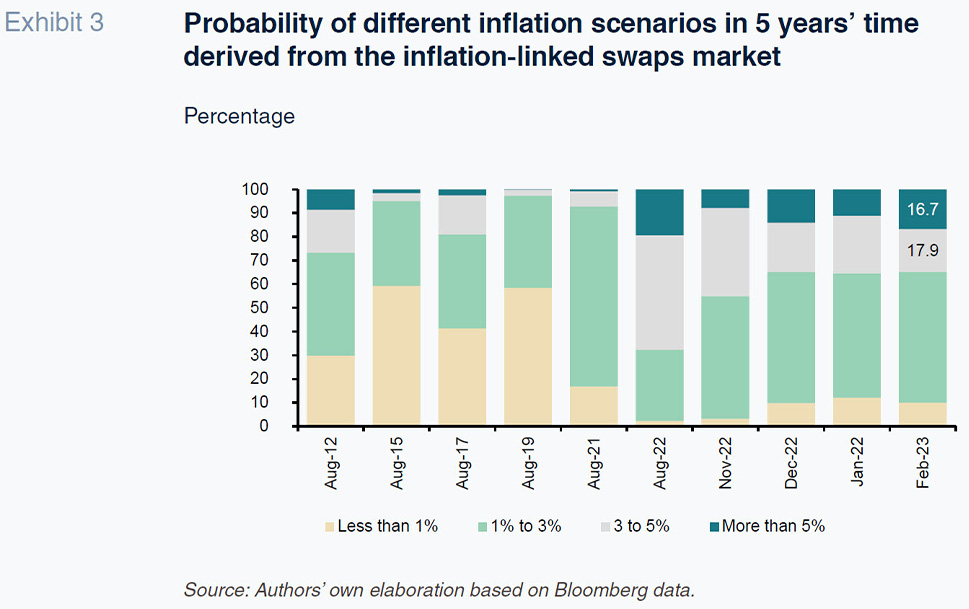
It is fair to say, therefore, that both the surveys and, especially, the market are discounting a medium-term inflation scenario of average rates slightly above the ECB’s target, with the probability assigned to a scenario of higher inflation still sufficiently high, in our opinion, to spark unease in the corridors of the ECB.
Real long-term rates
The significant decline in long-term interest rates observed across the leading economies between 2008 and 2021 was not only attributable to the decline in observed inflation but also a pronounced decrease in real rates of interest and their natural equilibrium rate. Now, following the surge in inflation in 2022 and 2023, real rates have risen sharply from negative levels, but remain low.
According to the classic definition, the real natural or neutral rate, r*, is that corresponding to an economy with full employment. Fisher (2017) suggests a pragmatic approach to its estimation: the real natural long-term rate of interest is that which balances the supply of savings with demand for investment in the long-term when an economy is at full employment. Low real rates by historical standards are indicative of either a surplus of savings or a slump in demand for investment, or both things at once. Low real rates are a common characteristic of all industrialised economies and a cause for concern for several reasons: they can increase the risk of falling into a liquidity trap of the kind detected by Keynes; they can be the result of secular stagnation of the kind described by Summers (2016); they could cause financial instability by encouraging investors to take on higher risks in search of returns; or they could be sending us a very clear message about the economy’s potential output.
Indeed, the factors explaining low real rates in a global world can be mapped out, following Fisher and Lane (2019), as follows:
- Low potential output reduces profitable investment opportunities for an economy’s businesses and leads its households to expect lower growth in their income, prompting them to spend less and save more. In the US, it was estimated in 2017 that the economy’s potential output was 1.7% compared to twice that on average during the 20 years prior to the financial crisis of 2008.
- Smaller imbalances in the current account balances of the various monetary areas. The fact that low real rates are a global phenomenon suggests that the reduction in the US current account deficit since 2008 has been the manifestation of lower net demand for overseas savings.
- Population pyramid. As populations age, the weight of the retired population increases so that borrowings fall and savings increase.
- Lower investment. Greater political or economic uncertainty, the impact of technological change on the viability of business models or on obsolescence, reduced competition, the replacement of riskier assets with higher quality assets and increased concentration among enterprises are some of the factors that could be delaying business investments.
All those factors have driven a reduction in the real natural rate of interest and there are reasons to believe they remain at play today. The real natural long-term interest rate is not directly observable. However, it has been estimated that in the US it has fallen from an average of 2% before the crisis of 2008 to 0.5%. In the eurozone, in 2019, Lane (2019) calculated the long-term natural rate at close to or even below zero, specifically in a range of between -1.5% and 0.5%, in contrast to a positive range from 0.5% to 2% in 2008. The drop in natural long-term rates had reduced the space for conventional policy around these interest rates. Expansionary monetary policy attempts to place benchmark money market rates sufficiently low to induce a reduction in long-term rates, to below their natural rates, in order to contribute to economic growth. If natural levels are already very low or even negative, how can this be done? That has been the major challenge for expansionary monetary policy for most of the last decade and the origin of the authorities’ use of asset purchases (QE) and other unconventional measures.
According to our estimations for the period from 2004-2023 (Exhibit 4), the real long-term rate of interest in the eurozone stood at around 2% until 2008. After that, it dipped sharply, even turning negative, a trend exacerbated during the pandemic, when it ranged between –1% and zero, as shown in the Exhibit we have built over 10-year IRSs. More recently, following the reopening of the economy in 2021 and the inflationary shock caused by the war, real rates have climbed back into positive territory, to around 1%.
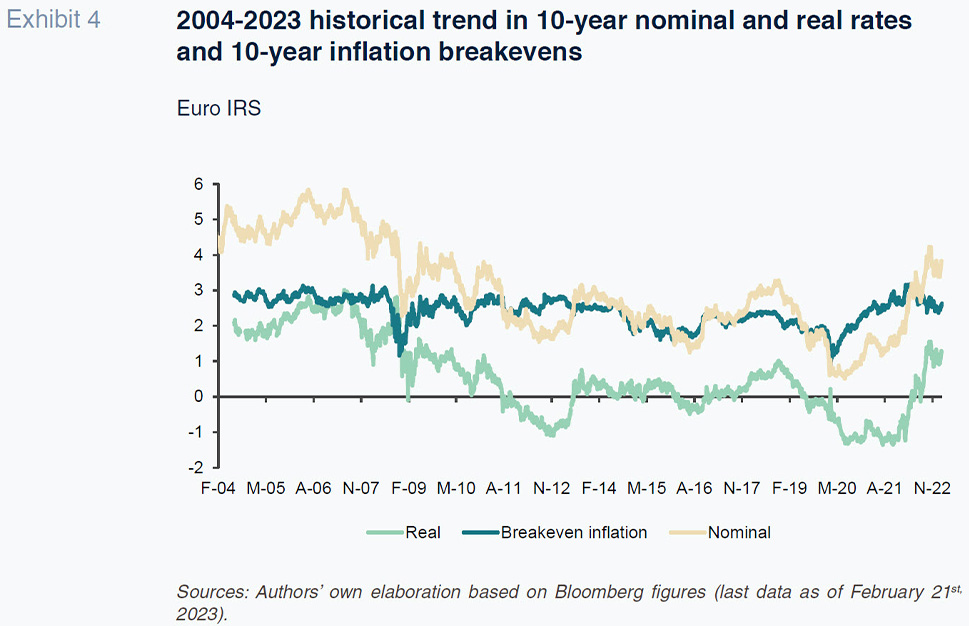
That level remains low by historic standards and that is because most of the factors responsible for the low natural rates of interest remain at play. It is conceivable that we are currently close, but still above, the natural rates. In other words, the benchmark rate increases discounted by the euro yield curve, to 3.5% by June 2023, appear to have put long-term real rates at restrictive levels, somewhat above their correspondent natural real rates, albeit still low in historical terms.
Conclusions: Are long-term rates already at stable levels?
Long-term nominal rates, as we have seen in this paper, depend on three major factors. The first, real rates. Although the real natural long-term rate of interest will remain low by historical standards for the structural reasons recapped here, several factors recommend caution before concluding that current real long-term rates are sufficiently stable so that future shifts in the yield curve, in either direction, will pivot around those anchors.
The second factor relates to the structure of supply and demand, in which the central bank’s balance sheet is playing a key role. The fact that the ECB has not reduced its bond portfolio more aggressively, its prior debt purchases having had a significant impact on lowering long-term rates while in place, suggests significant upside as the rest of those positions are gradually unwound. A lot will depend on the speed with which the ECB reduces its bond portfolio after it revisits its pace in June.
Lastly, long-term inflation expectations. Although they are relatively well anchored around 2%, the perceived risk of higher inflation in the long term is not negligible. If that were to materialise, monetary policy would have to be tightened further to quell inflation. In that event, in addition to raising benchmark rates further, it is more likely that the ECB would use its debt portfolio to exert pressure on real rates, pushing them above their neutral level, so reinforcing the impact of more contractionary short-term rates and nudging nominal rates higher all along the rest of the curve.
References
AHNERT, T., ANAND, K. and KÖNIG, P. J. (2022). Real interest rates, bank borrowing and fragility.
ECB Working Papers, No. 2755.
BUUNDICK, B. and SMITH, A. L. (2020). Policymakers have options for additional accommodation: forward guidance and yield curve control.
Economic Bulletin. Federal Reserve Bank of Kansas City.
CLAEYS, G. (2021).
What Are the Effects of the ECB´s Negative Interest Rate Policy? Monetary Dialogue Papers. Bruegel.
EUROPEAN CENTRAL BANK. The effects of APP reinvestments on euro area bond markets. Closing remarks by Benoît Cœuré, Member of the Executive Board of the ECB, at the ECB’s Bond Market Contact Group meeting, June 12
th, 2019.
https://www.ecb.europa.eu/
press/key/date/2019/html/ecb.sp190612_1~1a3bede969.en.html EUROPEAN CENTRAL BANK. Overview of the €STR.
https://www.ecb.europa.eu/stats/financial_markets_and_interest_rates/euro_short-term_rate/html/index.en.htmlEUROPEAN CENTRAL BANK. Survey of Professional Forecasters.
https://www.ecb.europa.eu/
stats/ecb_surveys/survey_of_professional_forecasters/html/index.en.htmlFERREIRA, T. and DAVIN, C. (2022). Longer-run neutral rates in major advanced economies. FEDS Notes, Federal Reserve Board.
FISHER, S. (2017). The low level of global real interest rates. Speech, Federal Reserve Board.
GULATI, C. and SMITH, A. L. (2022). The evolving role of the Fed’s balance sheet: effects and changes.
Economic Review, 4Q. Federal Reserve Bank of Kansas City.
LANE, P. R. (2019). Determinants of the real interest rates. ECB, Speeches.
ROGOFF, K. S., ROSSI, B. and SCHMELZING, P. (2022). Long-run trends in long-maturity real rales.
SCHNABEL, I. (2022). Monetary policy in a cost-of-living crisis. ECB, Speeches.
Ignacio Ezquiaga and José Manuel Amor. Afi