
The effects of corporate tax on corporate productivity: Impact at the micro-level
Although empirical evidence reveals a correlation between company size and productivity, the effectiveness of public policies designed to boost productivity by promoting an increase in company size alone is limited. Instead, data indicate that the relationship between size, corporate tax rates and investment is more significant when it comes to enhancing productivity.
Abstract: One of the most comprehensive measures of corporate productivity is total factor productivity (TFP), which quantifies the efficiency with which inputs are used in production. One factor that affects TFP is the corporate tax rate. In fact, data show that a 10-point reduction in the statutory rate of corporate income tax would increase national growth rates between 1% and 2%. A recurring debate among both economists and policymakers relates to the nature of the relationship between business size and productivity. Interestingly, in Spain, large companies with at least 250 employees account for 39.1% of gross value added (GVA). However, while policymakers may be tempted to prioritize an increase in average company size to improve productivity, such initiatives overlook other determinants of this variable. As well, the evidence indicates that productivity shocks lead to increases in company size but that this relationship does not function in reverse. However, data do show that corporate tax rates, through their impact on investment, do undermine productivity for companies of all sizes, with a particularly negative effect on smaller companies due to their lower technological intensity and productivity.
Corporate tax and productivity: What to measure and how to measure it
Corporate productivity is a measure of efficiency that relates output, such as the quantity of products (Q) or value added (GVA), with the amount of labour (L) and capital (K) used. Depending on how the numerator is defined, partial (or single factor) or multifactor productivity measures (OECD, 2001) are the basis for analysis. Labour productivity is one of the most widely used partial measures on account of its simplicity. For example, it features in international publications such as the OECD’s
Entrepreneurship at a Glance. Alternatively, one of the most comprehensive measures is total factor productivity (TFP), also known as the ‘residual’ or the index of ‘technical progress’ (Nadiri, 1970). The TFP concept is commonly expressed using the Cobb-Douglas function:

where A is a non-observable variable (residual), which Solow identified as total factor productivity. Solving for A, we get:

This ratio relates the output obtained to the inputs used to generate it. As a result, we can use TFP to quantify the efficiency with which inputs are being used in production. That efficiency, which is not directly observable, depends on factors such as business management, business owners’ skills, the institutional environment and the technology used in productive activity. Bloom et al. (2019) have determined that business management accounts for over 20% of changes in productivity, which is similar or even higher to the weight attributable to investment in R&D, information and communication technology, and human capital.
By definition, increases in TFP indicate more efficient use of the related inputs. There are two reasons why it is essential to assess the trend in and determinants of TFP over time when designing economic policy. Firstly, the differences observed between countries in growth and income per capita are largely attributable to different levels of productivity (Easterly and Levine, 2000). Secondly, it is important to understand which factors affect productivity growth (e.g., innovation, institutional framework, taxation) in order to correctly design economic policy instruments (Syverson, 2011).
One factor that affects national productivity, and economic growth by extension, is the corporate tax rate (Romer and Romer, 2007). For example, Lee and Gordon (2005) have found, using aggregate data, that a 10 point reduction in the statutory rate of corporate income tax would increase national growth rates between 1% and 2%. Similarly, Djankov
et al. (2010) have shown that a 10% increase in the effective rate of corporate tax would reduce the ratio of investment-to-GDP by two points. However, this macroeconomic model presents considerable limitations. Importantly, the statutory rate does not consider the overall effect of corporate taxation. In fact, it obviates other aspects of the tax that are as or even more important than the statutory rate in terms of: (i) the overall sum of taxes paid; and, (ii) investment decision-making. Notable among those aspects are the various depreciation methods permitted. These include the economic depreciation of assets and the existence of tax relief on investments. The microeconomic approach, based on individual firm data, makes it possible to fine-tune the analysis by factoring in the comprehensive effect of corporate taxation on productivity.
[1]
Given the limitations associated with the statutory rate, the best tools for measuring the impact of tax on productivity are the so-called forward-looking measures. These measures enable analysis of the impact of taxation on investment project returns over the life of the assets. Specifically, this refers to the time from when they are commissioned until they are decommissioned. Assets reach their end of life either because they have become technically obsolete or have fully depreciated. The universe of forward-looking tools includes the user cost of capital (Hall and Jorgenson, 1967), the marginal effective rate (King and Fullerton, 1984) and the effective average rate (Devereux and Griffith, 1998). The expression and interpretation of each of these three measures is provided in the accompanying Appendix.
Corporate tax, size and productivity: Is there any connection?
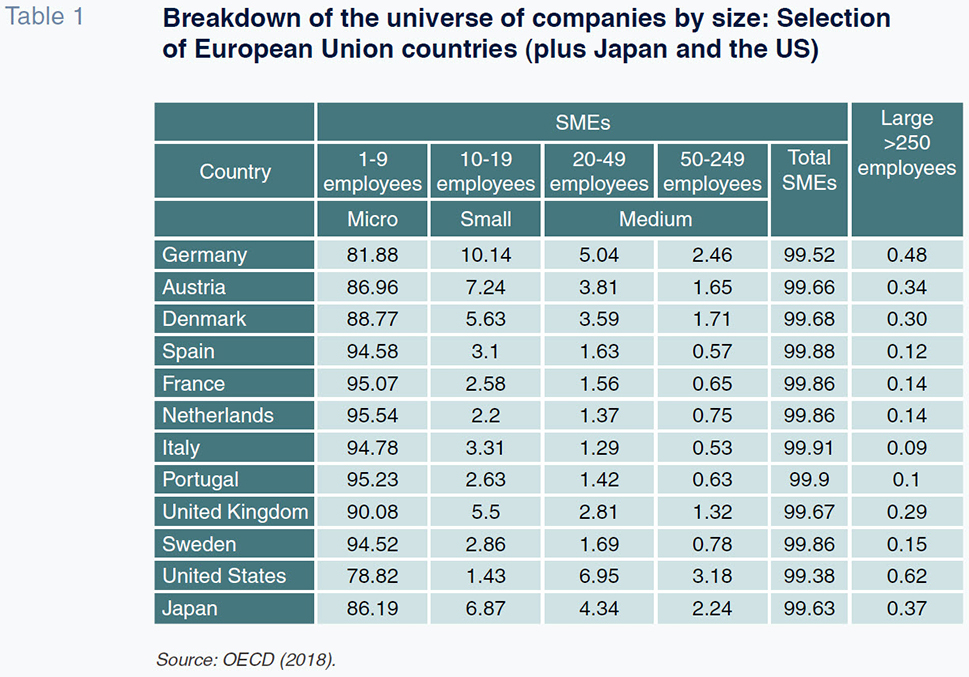
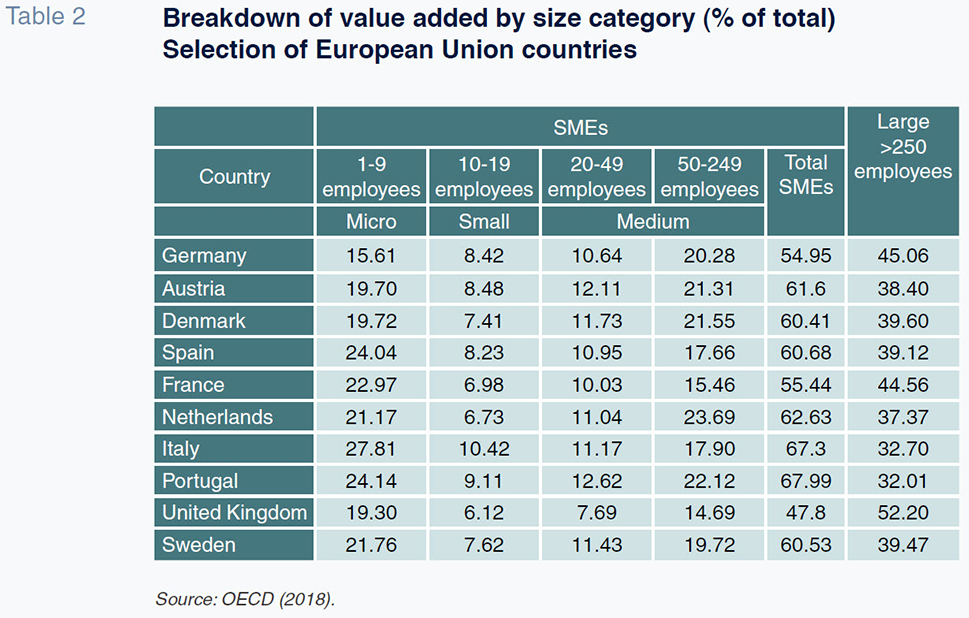
The nature of the relationship between business size and productivity is a recurring debate in both academic literature and the political sphere. Table 1 provides a comparison of average company sizes for a selection of European Union states, alongside Japan and the US. Table 2 shows the contribution to value added by size category in their respective countries. The figures show that over 99% of all companies are SMEs (under 250 employees). Within the SME category, the predominant size is that of micro enterprises (under 10 employees), albeit garnering far higher weights in the southern EU states (close to 95%) than in the US (78.8%), Germany (81.9%), Japan (86.2%), Austria (87.0%) or the UK (90.1%).
[2] A hallmark of the latter countries is the greater weight commanded by SMEs with between 10 and 49 employees. For instance, this category accounts for 15.2% of SMEs in Germany versus 4.7% in Spain. The GVA generated by the SMEs in their respective countries is clearly below the share they command in terms of number of enterprises. In Spain, SMEs account for 99.8% of all companies but their contribution to GVA is 60.7%. Large companies account for fewer than 1% of the total but their contribution to GVA ranges from 32.0% in Portugal to 52.2% in the UK. In Spain it is 39.1%. Productivity is a key factor in explaining the discrepancies observed between the weight of the various company size categories and their contribution to GVA. It is important to note, however, that: (i) the intensity of those differences varies considerably between countries (OECD, 2014, 2018); and, (ii) they are more pronounced in the manufacturing sector than in the services sector.
The available evidence shows that size counts in terms of productivity (OECD, 2014). This empirical consensus could lead us to infer that policymakers should prioritize an increase in average company size in order to increase their economies’ productivity. However, there are several important caveats to examine. Firstly, increasing company size alone, via fiscal policy for example, does not alter key aspects of productivity growth such as corporate culture, innovation or international expansion (Huergo and Jaumandreu, 2004; Huerta and Salas, 2017). Secondly, the evidence indicates that productivity shocks lead to increases in company size but that this relationship does not function in reverse. At least in the short term, a shock in company size shaped by a specific public policy may not lead to productivity gain (Moral-Benito, 2018). In sum, we must be cautious regarding the implementation of public policies designed to increase company size as the sole path to achieving productivity gains.
There are two channels through which corporate tax has an impact on the differences in productivity observed by size. Namely, (i) the availability and cost of the financing needed to pursue investment projects; and, (ii) the incentive to assume investment projects due to the impact on returns. Corporate tax drives a wedge between the gross and after-tax returns on investment projects. For example, it can influence the decision to build a new factory to cater to growth in demand. The size of that wedge has an impact on the incentive or disincentive to invest and assume risks (Federici and Parisi, 2015). Similarly, the wedge and its size also affect the amount of financial resources available from internally generated funds. This channel is key for companies that face financial constraints and whose ability to fund investments is related to their net profit (refer to Whited, 1992, among other authors), resulting in markedly pro-cyclical investment planning (Jiménez, Moral-Benito and Vegas, 2018). It is particularly problematic for the smallest-sized companies which have a higher probability of facing financial constraints (Oliveira and Fortunato, 2006; Aghion, Fally and Scarpetta, 2007; Wehinger, 2013).
The financial constraints problem is one of the arguments in favour of taxation thresholds in the design of corporate tax rates. Thresholds are special regimes in which smaller-sized companies (based on metrics such as revenue, employees and assets) benefit from lower statutory rates than their larger counterparts. There is some experience with thresholds in EU countries such as Belgium, the Netherlands, Luxembourg, the UK, Spain, Latvia and Lithuania (European Commission, 2012). From a theoretical perspective, thresholds are a mechanism for protecting smaller companies
vis-á-vis larger companies. They are used to foster smaller firms’ survival in the short-term and their growth in the long-term. However, the evidence suggests that these thresholds discourage companies from pursuing further growth. One explanation is that the threshold could force companies to stay below a certain size so as to avoid having to pay a higher tax rate (Guner, Ventura and Xu, 2018; Tusuruta, 2018). In other words, far from protecting the small companies, thresholds may prove self-defeating in both the medium- and long-run. Faced with this evidence, some countries, including Spain, have opted to eliminate taxation thresholds and apply a flat rate of corporate income tax to all companies. Since 2016, the general rate of tax has been 25% and the reduced rates that used to be applied to smaller-sized companies (revenue of < €10 million) have been eliminated.
[3]
Income tax, total factor productivity and company size: What does the microeconomic evidence tell us?
At the macroeconomic level, there is evidence of a negative correlation between taxes and productivity. The aggregate data do not, however, permit detailed analysis of whether company size or longevity are relevant to the correlation or whether corporate income tax has a more adverse effect on the TFP of companies that are moving towards or away from the technological frontier. The firm-level approach, which explicitly factors in business heterogeneity, can be used to draw conclusions for the optimal design of corporate tax in aspects such as tax breaks or reduced rates. The evidence at the microeconomic level is, however, very slim. As far as we are aware, there are papers by Schwellnus and Arnold (2008), Arnold et al. (2011) and Gemmel et al. (2018) for the OECD countries. In addition, we have the recent work of Romero-Jordán, Sanz-Labrador and Sanz-Sanz (2019), which examines the Spanish case.
Results based on firm-level data for the OECD
Schwellnus and Arnold (2008) analyse the role of corporate tax in productivity and investment for a sample of companies from OECD countries between 1996 and 2004. The data are taken from the Amadeus database but exclude the Eastern European companies. The results show that corporate tax has an adverse effect on all companies, irrespective of their size or longevity, the only exception being the smallest companies and start-ups, on account of their low profitability. Beyond size, taxation penalises those companies closest to the technological barrier more intensely, even in low-margin sectors. The results show the negative impact of corporate tax on investment that undermines TFP. In the long term, the elasticity of investment to the user cost of capital is -0.7. In a later study, Arnold et al. (2011) use a sample of companies from 13 OECD countries between 1981 and 2001. In that study, the authors also find a negative correlation between the effective rate defined by Devereux-Griffith and TFP, suggesting that lower returns on investments have negative effects on productivity. The authors maintain that this connection arises by discouraging corporate investment. Specifically, the results show that an increase in the user cost of capital affects investment decisions, with a relatively greater impact at the more profitable companies, irrespective of their size. Their simulation shows that a five point reduction in the statutory rate would reduce the user cost of capital by 2.8%. Gemmel et al. (2018) use a sample of companies from 11 OECD countries between 1995 and 2005. Their findings demonstrate that corporate tax slows productivity growth. Furthermore, the study illustrates how tax affects investment decision-making differently at large and small companies. The reason is that smaller companies are financially more constrained and therefore more sensitive to statutory tax rates, affecting both the timing of their planned investments and the types of assets they invest in.
Evidence in Spain
In Spain, there is a body of recent literature analysing total factor productivity from different perspectives (Fu and Moral-Benito, 2018; Jiménez, Moral-Benito and Vegas, 2018; Moral-Benito, 2018). However, as far as we know, Romero-Jordán, Sanz-Labrador and Sanz-Sanz (2019) is the only paper to analyse the impact of corporate tax on productivity, taking a microeconomic approach. Their work uses firm level data taken from the Survey About Business Strategies (ESEE for its acronym in Spanish) between 1990 and 2010. Following the methodology of Gemmel et al. (2018), the empirical study is divided into two steps. In the first step, the authors estimate TFP for each of the companies in the sample. In step two, they study the impact of corporate tax on growth in TFP. The paper factors in company size, distinguishing the pattern at the smallest companies (fewer than 20 employees) from the rest. It considers differences in technological intensity using the National Statistics Office’s classification of the various industrial sectors in Spain.
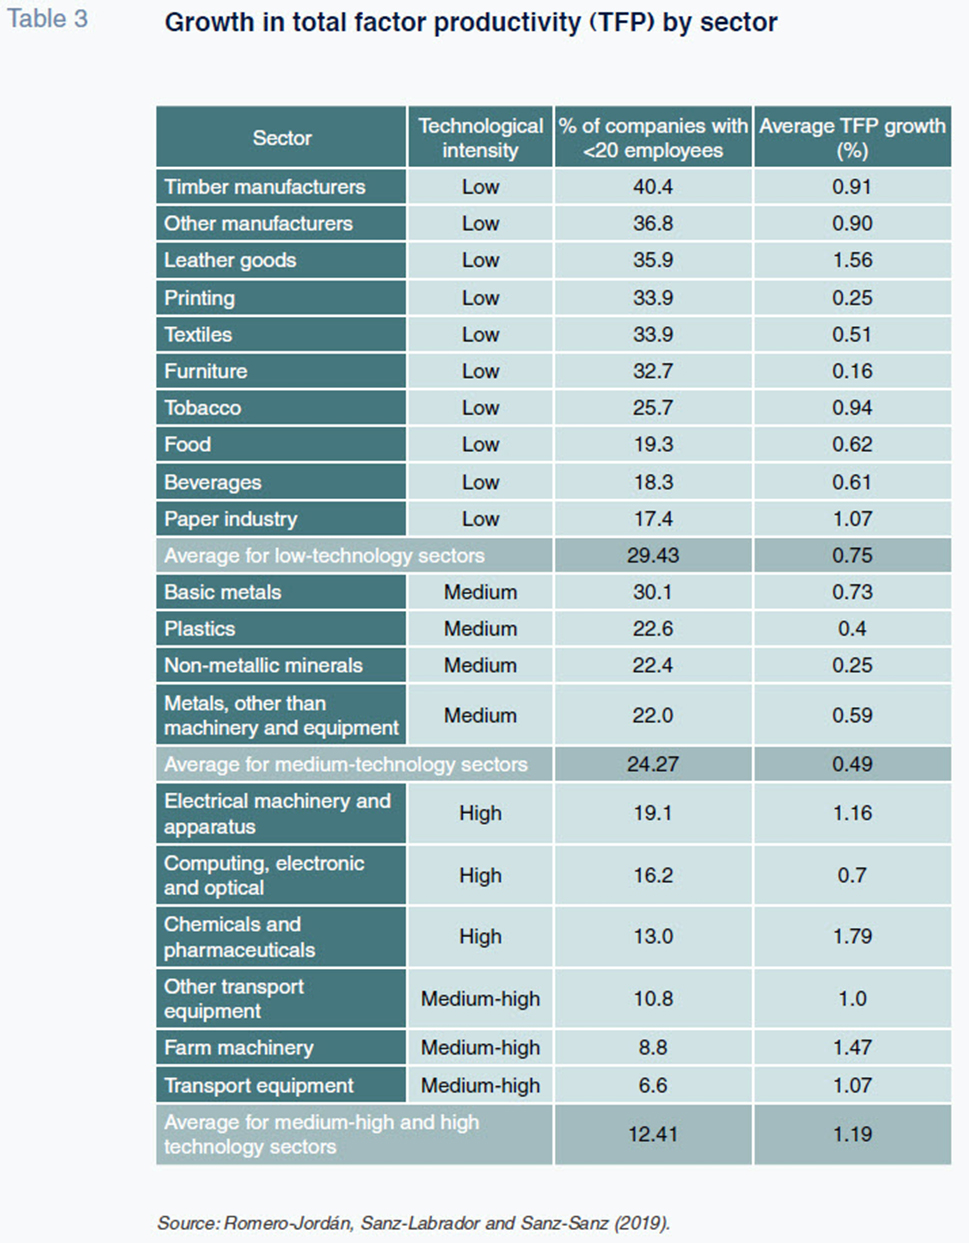
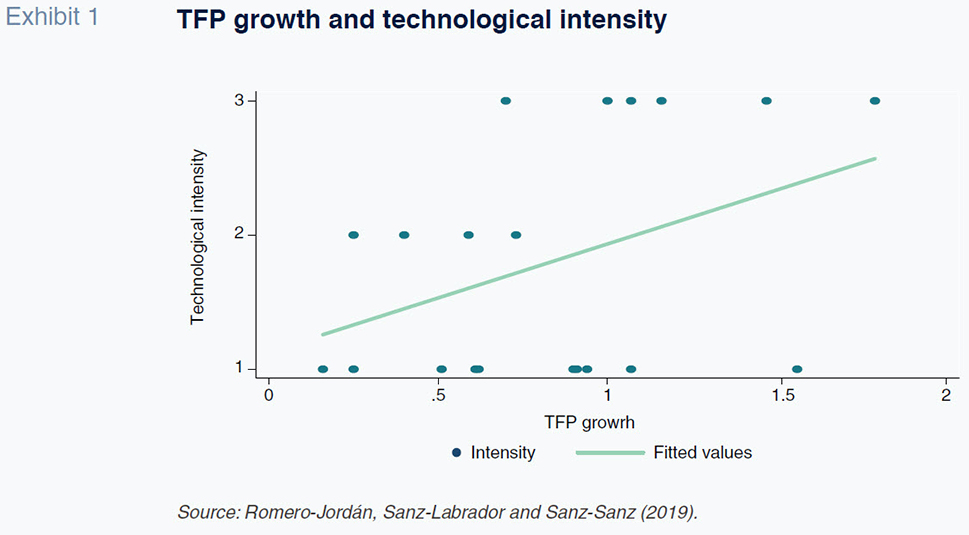
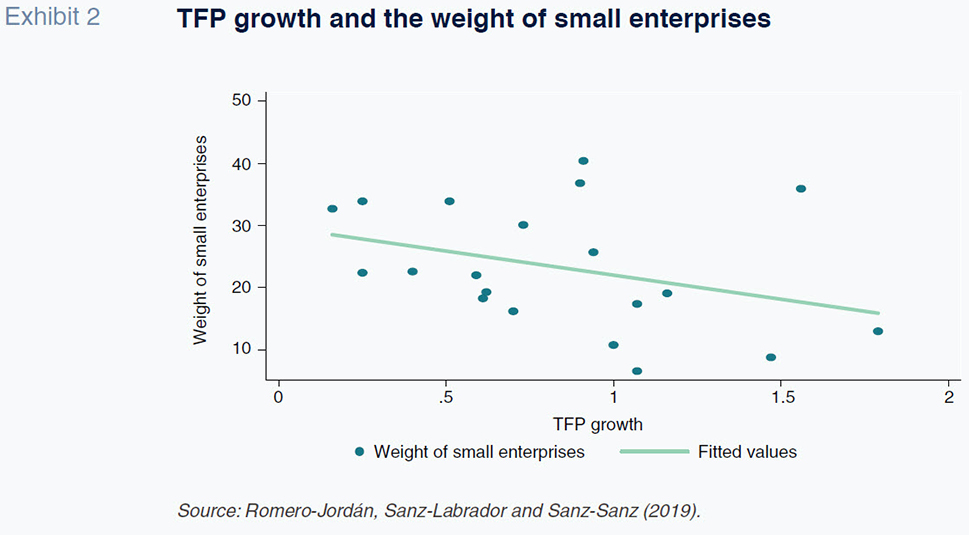
Table 3 shows the average growth in TFP for each of the 20 sectors analysed, alongside the percentage of small companies in each of those sectors. The results reveal considerable dispersion in the readings for these two variables. The average incidence of small companies ranges between 6.6% and 40.4%, while growth in TFP ranges between 0.16% and 1.79%. On average, the sectors that make less intensive use of technology are composed of a higher proportion of small companies while the sectors with a large population of small companies present lower growth in TFP. The correlation between these three variables —technological intensity, incidence of small companies and growth in TFP— is easier to see in Exhibits 1 and 2. For example, in the timber manufacturing sector, which has a low level of technological intensity, the penetration of small companies is 40.4%, compared to 13.0% in the chemicals and pharmaceuticals sector, which is considered high tech. In parallel, the timber manufacturing sector presents average growth in TFP of 0.91%, compared to 1.79% in the chemicals and pharmaceuticals sector.
Having estimated the TFP growth rates, Romero-Jordán, Sanz-Labrador and Sanz-Sanz (2019) go on to analyse the impact of corporate tax on that variable by using both the user cost of capital and the effective rates outlined in the Appendix. The results show that corporate tax has a negative impact on growth in TFP regardless of whether the user cost or effective tax rates are included in the regression analyses. The impact is, however, higher in the case of the companies operating in the more profitable sectors, confirming that corporate tax penalises growth in those companies’ TFP, regardless of size. However, the results also show that the constrictive impact of tax on TFP growth is more intense in relative terms for the smaller companies due to their lower technological intensity and productivity. Therefore, corporate tax can perpetuate these gaps with respect to the leading companies in productivity terms. The authors conclude that corporate tax has adverse effects on companies’ investment decisions (extensive margin) and on the scale of their investments (intensive margin).
Conclusion
The scant evidence available at the microeconomic level shows that corporate tax penalises growth in productivity. That effect is more intense for smaller companies as a result of the financial constraints they face, which condition the timing of their investments and the types of assets they invest in. Taxation impedes companies from catching up with their sector leaders in terms of productivity (those closest to the technological frontier), irrespective of their size. The adverse effect of corporate tax on investment is key factor.
Notes
The increase in the number and quality of firm-level data repositories in the last decade has provided an impetus for analysing the relationship between tax and productivity from a microeconomic perspective.
A range of factors explain the higher weight of micro enterprises, including differences in business cultures, the existence of financial constraints and the institutional framework (OECD, 2014; Huerta and Salas, 2018).
With the odd exception, such as start-ups.
References
AGHION, P., FALLY, T. and SCARPETTA, S. (2007). Credit Constraints as a Barrier to the Entry and Post Entry Growth of Firms: Theory and Evidence. Economic Policy, 22, pp. 731-779.
ARNOLD, J. T., BRYS, B., HEADY, C., JOHANSSON, A., SCHWELLNUS, C. and VARTIA, L. (2011). Tax Policy for Economic Recovery and Growth. Economic Journal, 121, pp. 59-80.
BLOOM, N., BRYNJOLFSSON, E., FOSTER, L., JARMIN, R., PATNAIK, M., SAPORTA-EKSTEN, I. and VAN REENEN, J. (2019). What Drives Differences in Management Practices? American Economic Review, 109, pp. 1648–1683.
CASSIMAN, B., GOLOVKO, E. and MARTÍNEZ-ROS, E. (2010). Innovation, exports and productivity. International Journal of Industrial Organization, 4, pp. 372-376.
DEVEREUX, M. P. and GRIFFITH, R. (1998). Taxes and the location of production: Evidence from a Panel of US Multinationals. Journal of Public Economics, 68, pp. 335-367.
DJANKOV, S., GANSER, T., MCLIESH, C., RAMALHO, R. and SHLEIFER, A. (2010). The Effect of Corporate Taxes on Investment and Entrepreneurship. American Economic Journal: Macroeconomics, 3, pp. 31-64.
EASTERLY, W. and LEVINE, R. (2000). It’s Not Factor Accumulation: Stylized Facts and Growth Models. Washington, D.C.: World Bank.
EUROPEAN COMMISSION. (2012). Tax Reforms in EU Member States: Tax Policy Challenges for Economic Growth and Fiscal Sustainability, 2012 Report. Luxembourg: Office of Official Publications of the European Communities.
FEDERICI, D. and PARISI, V. (2015). Do corporate taxes reduce investments? Evidence from Italian firm-level panel data. Cogent Economics & Finance, 3, 1012435.
FU, C. and MORAL-BENITO, E. (2018). The evolution of Spanish total factor productivity since the global financial crisis. Occasional Papers, 1808, Bank of Spain.
GEMMELL, N., KNELLER, K., MCGOWAN, D., SANZ, I. and SANZ-SANZ, J. F. (2018). Corporate taxation and productivity catch-up: evidence from European firms. Scandinavian Journal of Economics, 120, pp. 372-399.
GUNER, N., VENTURA, G. and XU, Y. (2008). Macroeconomic implications of size-dependent policies. Review of Economics Dynamics, 11, pp. 721-744.
HALL, R. E. and JORGENSON, D. W. (1967). Tax Policy and Investment Behavior. American Economic Review, 57(3), pp. 391-414.
HUERGO, E. and JAUMENDREU, J. (2004). International Journal of Industrial Organization, 22(4), pp. 541-559.
HUERTA, E. and SALAS, V. (2018). Productividad y tamaño de las empresas: ¿Dónde están las palancas para el cambio? [Productivity and company size. Where are the drivers for change?].
HUERTA, E. and MORAL M. J., (Edit.), Innovación y Competitividad: desafíos para la industria española [Innovation and Competitiveness: the challenges for Spanish industry], 425-462. Madrid: Funcas.
JIMÉNEZ, G., MORAL-BENITO, E. and VEGAS, R. (2018). Bank Lending Standards Over the Cycle: The Role of Firms’ Productivity and Credit Risk. Working Paper No. 1811. Bank of Spain.
KING, M. and FULLERTON, D. (1984). The taxation of income from capital. The University of Chicago Press, 1984.
LEE, Y. and GORDON, R. (2005). Tax Structure and Economic Growth. Journal of Public Economics, 89, pp. 1027–1043.
MORAL-BENITO, E. (2018). Growing by learning: firm-level evidence on the size-productivity nexus. SERIES, 9, pp. 65-90.
NADIRI, I. (1970). Some approaches to the theory and measurement of total factor productivity: A survey. Journal of Economic Literature, 8, pp. 1137-1177.
OECD. (2001). Measuring productivity. OECD Manual – Measurement of aggregate and industry level productivity growth. Paris: OECD.
— (2014). Economic Surveys, Spain. September. Paris: OECD.
— (2018). Entrepreneurship at a Glance 2018 - Highlights. Paris: OECD.
OLIVEIRA, B. and FORTUNATO, A. (2006). Firm growth and liquidity constraints: A dynamic analysis. Small Business Economics, 17, pp.139-156.
ROMER, CH. and ROMER, D. (2007). The Macroeconomic Effects of Tax Changes: Estimates Based on a New Measure of Fiscal Shocks. NBER Working Paper Series, Working Paper, 13264.
ROMERO-JORDÁN, D., SANZ-LABRADOR, I. and SANZ-SANZ, J. F. (2019). Is the corporation tax a barrier to productivity growth? Small Business Economics, in press. https://link.springer.com/article/10.1007/s11187-019-00136-x
SANZ-SANZ, J. F., ROMERO-JORDÁN, D. and BARRUSO, B. (2011). Imposición efectiva sobre las rentas del capital corporativo: medición e interpretación. El Impuesto de Sociedades en España y en los países de la Unión Europea en el cambio de milenio. [Effective tax on corporate capital income: measurement and interpretation. Corporate tax in Spain and the European Union at the turn of the millennium]. Estudios de la Fundación, 52. Funcas.
SCHWELLNUS, C. and ARNOLD, J. (2008). Do Corporate Taxes Reduce Productivity and Investment at the Firm Level?: Cross-Country Evidence from the Amadeus Dataset. OECD Economics Department Working Papers, 641, OECD Publishing.
SYVERSON, (2011). What Determines Productivity? Journal of Economic Literature, 49, pp. 326–365.
TSURUTA, D. (2018). SME policies as a barrier to growth of SMEs. Small Business Economics, in press.
WHEINGER, G. (2013). SMEs and the credit crunch: Current financing difficulties, policy measures and a review of literature. OECD Journal: Financial Market Trends Volume 2013/2.
WHITED, T. M. (1992). Debt, Liquidity Constraints, and Corporate Investment: Evidence from Panel Data. Journal of Finance, 47, pp. 1425–60.
Desiderio Romero-Jordán. Rey Juan Carlos University
José Félix Sanz-Sanz. Madrid Complutense University
Appendix
The user cost of capital is defined as follows:

where A is the tax saving via tax deductions; t is the statutory rate of tax; d is the discount rate; π is inflation; and δ represents the rate of economic depreciation. The user cost of capital corresponds to the shadow price of the capital services used by the company. In other words, it expresses the value for the investor of using capital goods in the productive process (Sanz, Romero and Barruso, 2011). An alternative interpretation often given to the user cost corresponds to the pre-tax financial return demanded on the assets used in the productive process so that an investment in those assets is profitable.
The King-Fullerton effective marginal rate is defined as follows:

where s is the net rate of return required by the investor supplying the funds for the project. In this manner, the numerator measures the total taxation borne for every euro invested. The effective marginal rate therefore measures the percentage tax burden borne for every euro invested in a given asset.
The Devereux-Griffith average effective rate is defined as follows:

where R* is the net present value of the economic rent before tax earned by the investment and R is its equivalent after tax. METR and AETR are two apparently very similar measures. The essential difference between the two is that the METR is used to discriminate between projects that are financially viable and those that are not. In contrast, the effective average rate identifies, for a given pre-tax financial return, the magnitude of the economic rent generated (Sanz, Romero and Barruso, 2011).