
Business dynamism in Spain: Recent trends and outlook
Although business dynamism has recovered in Spain since the crisis, there has been a marked shift in the composition of companies, with self-employment now exceeding LLCs when it comes to new business creation. Closer analysis of these data also reveals some noteworthy trends relating to the disappearance of medium-sized firms and the gendered nature of entrepreneurship in Spain.
Abstract: Spanish companies face the challenge of improving their competitiveness in an environment which, in the medium- to longer-term, could face rising interest rates. Against this backdrop, it is important to assess the level of business dynamism to anticipate forward-looking scenarios. Data from Spain’s central corporate database show that, although the rate of business creation now exceeds the rate of closure, it has not fully recovered to pre-crisis levels. Moreover, there has been a shift in the types of companies created in Spain. Prior to the crisis, LLCs were the most common form of corporation, but since 2014, self-employment has made the biggest contribution to new business creation. The reduction in medium-sized companies is also worth noting, with larger and smaller firms showing lower levels of decline. Lastly, data also indicate a gender gap when it comes to self-employment, where the percentage of men as employers with employees in relation to all men in work (6.3%) is twice that of women (3.2%).
[1]
IntroductionBusiness dynamism is currently negative in a number of advanced economies. In its most basic expression, business dynamism is the rate of creation of new companies relative to the total universe of companies.
[2]
The purpose of this paper is to explore the recent trend in business dynamism in Spain by analysing the main indicators published by Spain’s statistics office, the INE. To do so, we rely on the INE’s central companies database (DIRCE), and the active population survey (EPA).
Analysis of DIRCE enables us to verify whether the trends identified in an earlier study documenting a reduction in the number of public limited companies (PLCs) and growth in the number of self-employed individuals have continued (Xifré, 2016). Analysis of the EPA provides information about the gender mix in activities related with entrepreneurship, in line with recent studies looking at female entrepreneurship in Spain (Montero and Camacho, 2018).
Analysis of DIRCE data
Firstly, it is important to note that the data gleaned from DIRCE pertain to the number of companies in existence as of January 1st of every year. Exhibit 1 shows the trend in new companies and closures between 2000 and 2017, the last year for which these figures are available. It reveals three distinct periods for the creation and dismantling of Spanish businesses over the past 18 years.
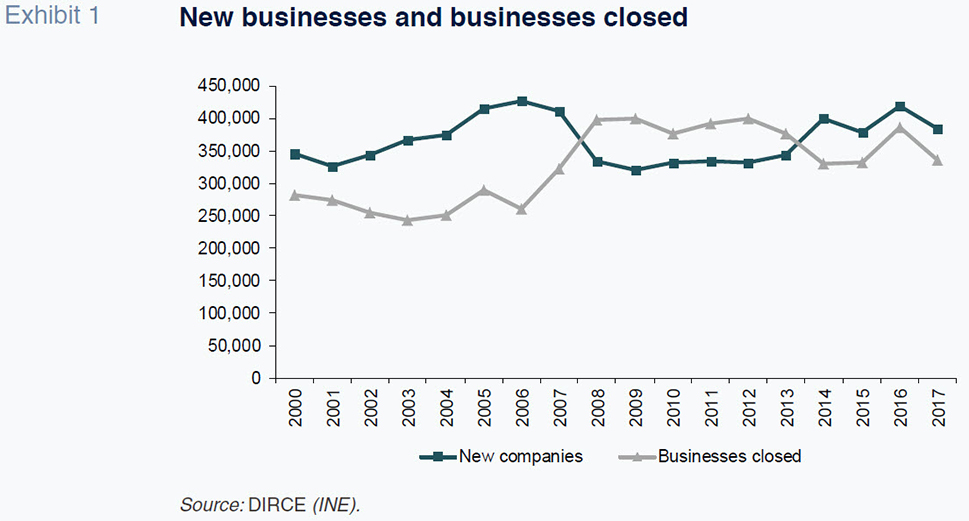
During the first period, which runs from 2000 until 2007, the number of new companies easily surpassed the number of firms closed, indicating significant business dynamism. Between 2008 and 2013, the trend inverts, with the number of closures outpacing the number of businesses opened, implying a net contraction of the corporate landscape. The third period begins in 2014 and has seen the number of new companies top the number of enterprises closed, albeit by a significantly narrower margin than during the first period.
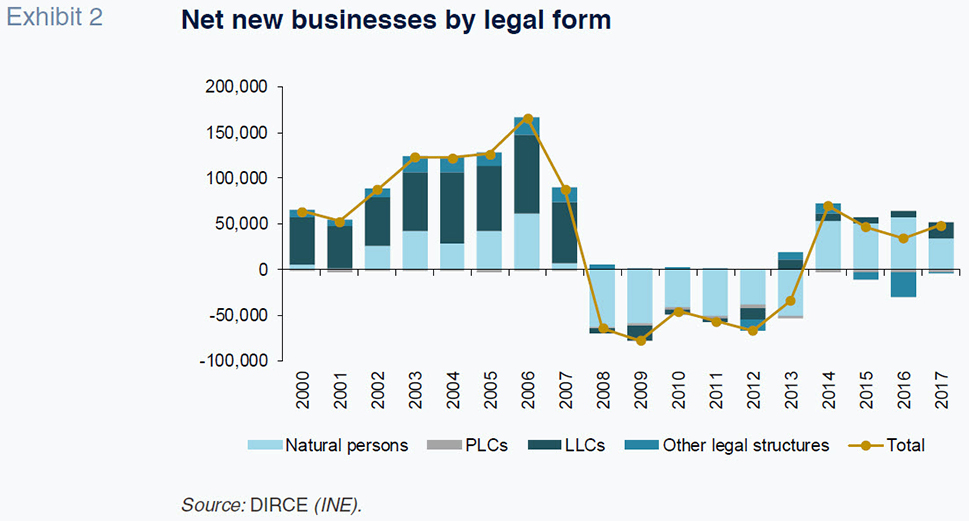
Exhibit 2 breaks down the net figures (new companies less companies closed) by legal structure, distinguishing between four categories: public limited companies (PLCs); limited liability companies (LLCs); natural persons/self-employed; and, other legal structures (cooperatives, independent bodies, partnerships, etc.). This breakdown reveals a significant shift in the pattern of net additions to the corporate landscape. Whereas during the period prior to the crisis, LLCs were the most common form of incorporation, since 2014, it is natural persons who have made the biggest contribution to new business creation, after having suffered the biggest number of net losses between 2008 and 2013.
Exhibits 3a and 3b relate the flow of companies with the stock of companies to depict the trend in the rate of business creation (new companies over total companies) and the rate of business destruction (companies closed over total companies) between 1999 and 2017 for the three main categories of companies: PLCs, LLCs and natural persons.
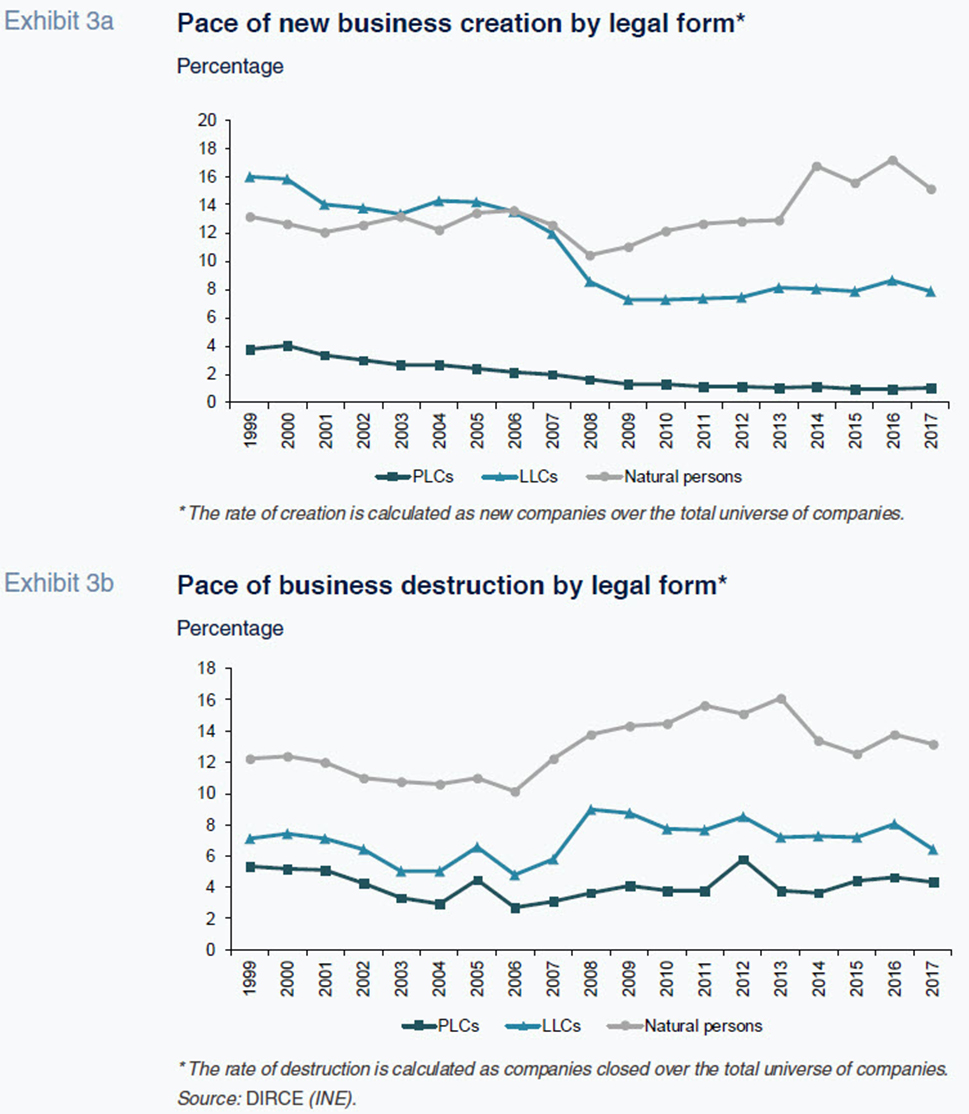
As illustrated in Exhibit 3a, the pace of PLC creation has collapsed, with this type of enterprise experiencing a consistent decline since 2000. As a result, the pace of business creation in 2017 (1%) was not much more than one-quarter of that observed in 1999 (3.8%). In the case of the LLCs, the pace of business creation has decreased by roughly half during the period from 16% to 8%, having fallen abruptly in 2007 and 2009 to levels from which it has failed to recover. These trends in new business creation are consistent with the evidence we have for other countries (Akcigit and Ates, 2019). In contrast, the creation of self-employment, having hovered at around 13% between 1999 and 2013, has since climbed steadily, reaching 15% in 2017.
Looking at company mortality, Exhibit 3b reveals somewhat more erratic patterns but with smaller differences between the beginning and end of the series. The pace of PLC destruction has fluctuated around 4. LLCs rate of closure has oscillated between 6% and 8% while that of the self-employed trended slightly lower during the first period (from 12% to 10% between 1999 and 2006) before going on to spike at 16% in the midst of the crisis and eventually flattening out at around 13%.
These trends are presented in Exhibit 4, which depicts the number of companies by legal structure rebased to the number in existence in 2008. It shows that the number of PLCs has fallen consistently since 1999. By 2018, this type of firm (at close to 79,000) had fallen by 30% compared to 2008. That year also marked the end of the era of growth in the universe of LLCs, which had doubled in number since 1999, having been fairly steady at around 1,150,000 entities. The number of natural persons has oscillated less significantly during the last 19 years, staying within a range of between 1,650,000 and 1,750,000 entities. Lastly, the trend in the other types of legal structures follows a pattern that is similar to that etched out by the limited liability companies.
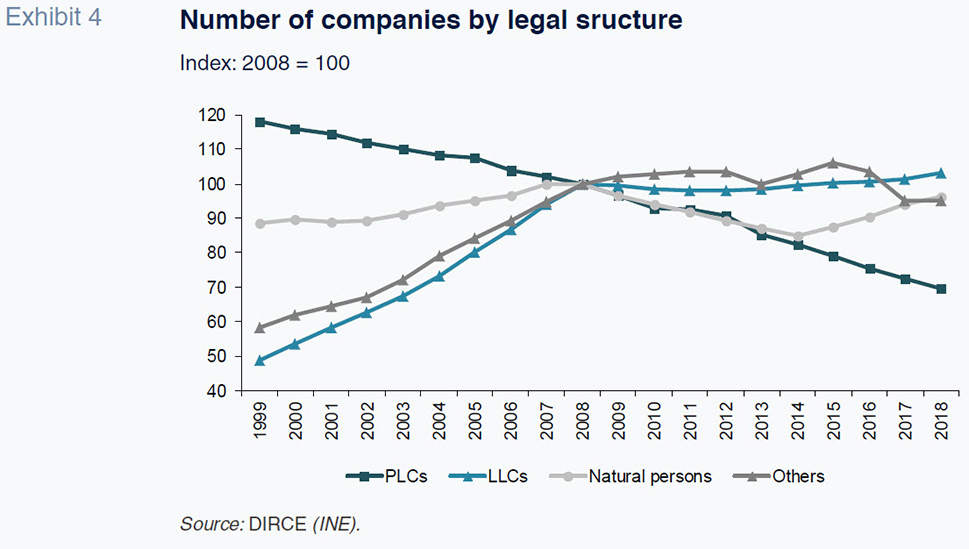
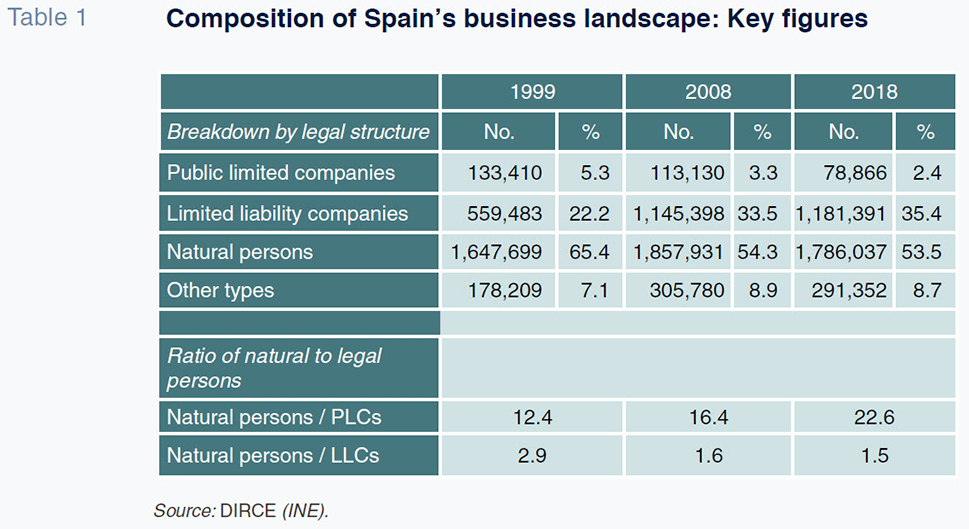
Table 1 summarises the data provided thus far. The composition of Spain’s business landscape over the past 19 years has been marked by a significant drop in the percentage of public limited companies and considerable growth in the penetration of limited liability companies. The growth in the latter has meant that the presence of self-employed individuals (despite having increased in absolute terms) has decreased in percentage terms from 65% to 54% of the total number of firms. As a result, the ratio of self-employed individuals to PLCs has virtually doubled in the last 19 years. Whereas in 1999 Spain had 12.4 self-employed individuals for every PLC, in 2018 this figure rose to 22.6. This development may help explain the sharp reduction in investment (fixed assets) observed since 2008 in the Bank of Spain’s figures, according to recent analysis by Rosell (2018). It is possible that the levelling off in corporate investment since 2008 is attributable to, in addition to growth in the level of utilisation of previously idle capital, a reduction in conventional corporate structures (staff) and their replacement by self-employed individuals who are, for legal purposes, not part of the company.
These changes in the mix of the different types of companies in the business landscape have been accompanied by changes within the universes of public limited and limited liability companies. Exhibits 5a and 5b depict the number of PLCs and LLCs, respectively, in 2018 in relation to those recorded in 2008, broken down into seven employee size categories. With respect to the figures presented in Table 1, the numbers in Exhibits 5a and 5b correspond exclusively to the companies with employees, i.e., entities without any employees have been excluded.
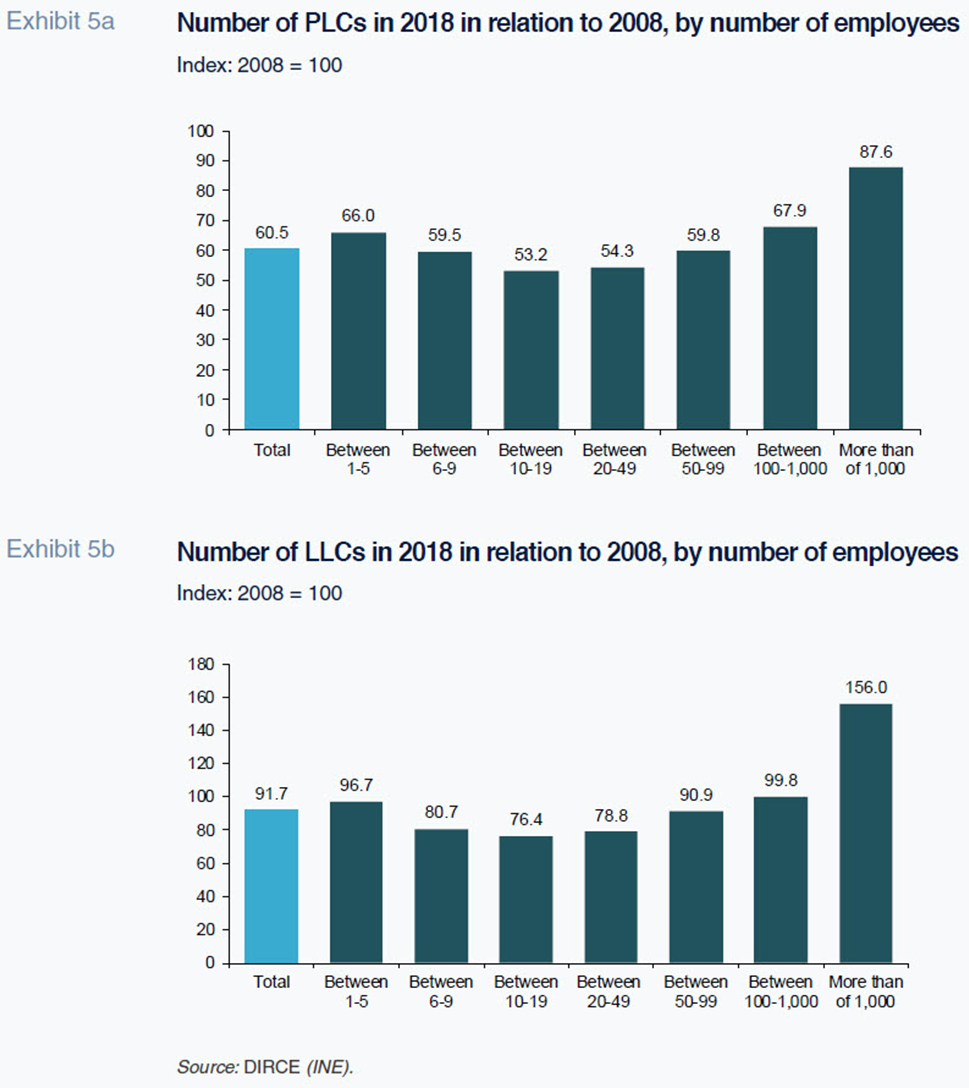
The exhibits clearly show polarisation in both company categories at either extreme. They reveal that the reduction in the number of companies has not been even across the various size segments. For both types of companies, the reduction has been more pronounced in the intermediate size categories (those with between 10 and 19 employees and those with between 20 and 49) and considerably less intense among the larger companies (those with between 100 and 1,000 employees and those with over 1,000) and the smallest firms (between 1 and 5 employees). The figures suggest a hollowing out of the medium-sized categories in terms of number of employees. It is worth highlighting that the number of LLCs with over 1,000 employees increased by more than 50% between 2008 and 2018, compared to an overall reduction of nearly 10% for all companies of the this category during the same period. Although company size is correlated with productivity, it has yet to be established that the former automatically benefits the latter. Instead, there is a universe of factors that determine company size and productivity, such as human endowment and professionalisation of the business’s management (Huerta and Salas, 2014). From that perspective, the relatively greater loss of medium-sized enterprises relative to small-sized enterprises could be a worrying sign.
Analysis of the EPA
An analysis of the results of the INE’s active population survey (EPA) provides additional information about the business landscape broken down by gender. This allows us to document differences in the rates of participation in entrepreneurial activities by gender.
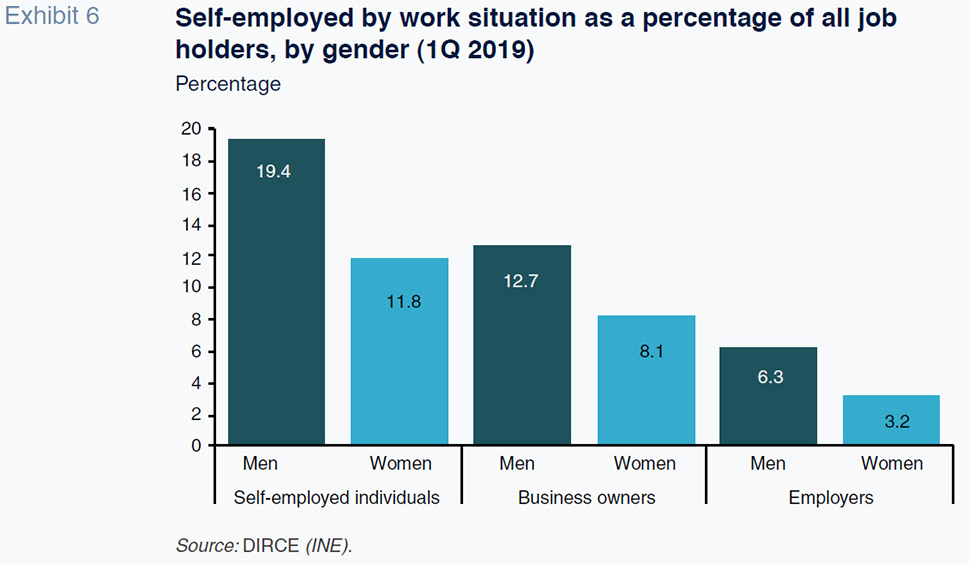
Exhibit 6 shows the percentage of three categories of self-employed individuals. The three categories are: 1. the total number of self-employed, which in turn encompasses the other two measures: 2. business owners without employees and 3. employers with employees. They are represented as a percentage of total job holders, distinguishing between men and women, for the first quarter of 2019. In each of the three categories, male participation is higher than female participation. Whereas over 19% of employed men work for themselves, that figure is below 12% among women. Similarly, nearly 13% of men in work qualify as ‘business owners without employees’, compared to just above 8% of women. Lastly, 6.3% of male job holders qualify as ‘employers with employees’, compared to 3.2% of women in work.
Exhibits 7a and 7b depict these three magnitudes for both genders between 2008 and 2019. The exhibits show that the gaps between male and female participation shown in Exhibit 6 have been relatively steady over the last 11 years.
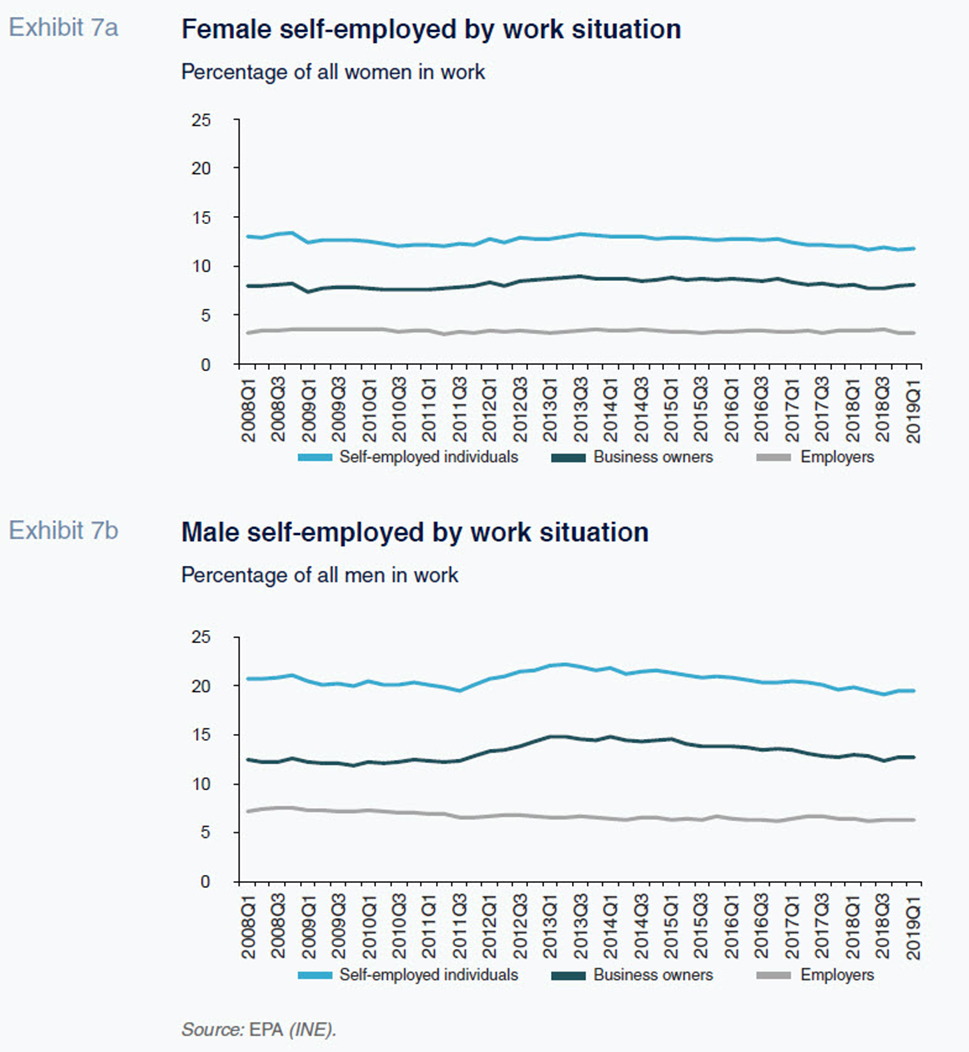
The interpretation of these gaps and the underlying factors is complex. It may be attributable to specific obstacles or barriers that impede women from pursuing entrepreneurial activities or a reduced preference on the part of women for these kinds of activities. A detailed analysis of the matter lies beyond the scope of this paper. What we can say is that the study and characterisation of female entrepreneurship is garnering growing attention (refer to Montero and Camacho (2018) and the references cited therein).
Conclusion
Spain’s companies face the challenge of improving their competitiveness in an environment which, in the medium- to longer-term, may face rising interest rates, (Rosell, 2018) as well as multiple other challenges (Huerta and Moral, 2018). Against that backdrop, it is important to understand the recent trend in the business landscape so as to anticipate forward-looking scenarios.
Firstly, this paper shows that net business creation has become positive since 2014, after the long period of stagnation during the crisis (2008-2013). The pace of new business creation is, however, proving slower than before the crisis. Not only has the intensity of business creation slowed, its composition has changed: the legal structure generating the highest number of net additions to the labour market is self-employment, whereas before the crisis, limited liability companies were the main growth driver.
The paper also shows how the number of public limited companies has fallen consistently between 2000 and 2018 (the last year for which the figures are available). As a result, the ratio of self-employed individuals to public limited companies has doubled during the period. This trend suggests an on-going reorganisation of the legal-employment conditions in which economic activity is being conducted. Conventional business arrangements (staff) are losing significance as self-employed individuals who engage with them are growing in importance. This substitution phenomenon may help explain the reduction in investment (fixed assets) by Spain’s businesses, as gleaned from an analysis of the Bank of Spain’s repository of corporate balance sheets (Rosell, 2018). It is necessary to analyse the causes and consequences of this phenomenon in detail.
As for size, the number of medium-sized enterprises (with between 10 and 49 employees) fell sharply between 2008 and 2018. Larger enterprises, but also those with fewer than five employees, have disappeared at a relatively lower rate. It is worth highlighting that the number of limited liability companies with more than 1,000 companies increased by 50% between 2008 and 2018.
Lastly, this paper analyses indicators of entrepreneurial activity from a gender perspective. We document the existence of a gap between male and female participation in self-employed work. In the specific instance of employers with employees, the percentage of men in this situation in relation to all men in work (6.3%) is twice that of women (3.2%).
These results show that Spain’s companies need to overcome certain challenges to improve their competitiveness. First of all, it will be necessary to find a balance between employees on the payroll and outsourcing to self-employed individuals. Secondly, it is important that Spain’s business landscape does not lose any more medium-sized enterprises. Lastly, it would be advisable to take measures to promote gender equality and remove barriers to entrepreneurship faced by women.
There are other ways of measuring business dynamism, such as the percentage of economic activity generated by firms in existence for less than five years or the productivity gaps between leader and follower companies (Akcigit and Ates, 2019).
The author would like to thank Emilio Huerta for his input.
AKCIGIT, U. and ATES, S (2019). Ten Facts on Declining Business Dynamism and Lessons from Endogenous Growth Theory. NBER Working Paper, 25755.
HUERTA, E. and MORAL, M. J. (2018). Innovación y competitividad: desafíos para la industria española [Innovation and competitiveness: challenges for the Spanish economy]. Funcas.
HUERTA, E. and SALAS, V. (2014). Tamaño de las empresas y productividad de la economía española [Company size and productivity in Spain]. Mediterráneo Económico, 25, pp.167-193.
MONTERO, B. and CAMACHO, J. A. (2018). Caracterización del emprendimiento femenino en España: Una visión de conjunto [Depiction of female entrepreneurship in Spain: the big picture]. REVESCO. Revista de Estudios Cooperativos, 129, pp.39-65.
ROSELL, J. (2018). Growth and competitiveness in Spain’s corporate sector: Recent trends and outlook. Spanish Economic and Financial Outlook, Vol. 7, No. 5, pp. 75-87.
XIFRÉ, R. (2016). Spain’s business landscape: Structure, recent developments and remaining challenges. Spanish Economic and Financial Outlook, Vol. 5, No. 3, pp. 57-65.
Ramón Xifré. ESCI-UPF School of International Studies Public-Private Sector Research Centre, IESE Business School