Spanish private debt dynamics: Indebtedness and debt service in a European context[*]
The deleveraging efforts of Spanish households and corporates has helped to bring down debt levels as a percent of GDP, as well as the debt servicing burden – both in absolute terms and compared to other EU countries. Ongoing deleveraging efforts, together with the persistence of benign funding conditions, will be needed to further bring down debt ratios and reduce financial vulnerability.
Abstract: The significant deleveraging effort by Spanish households and companies since 2010 has successfully reduced the weight of debt in GDP by 50 percentage points (pp), allowing for a reduction of the gap relative to the Eurozone average to 3.4pp, albeit remaining 13.4pp above the average for the EU-28. Deleveraging, together with an improvement in corporate earnings and household gross income, has significantly improved debt sustainability. The latest data show that Spanish companies need the equivalent of 4.7 years of gross operating surpluses to fully pay off all their debt, compared to 4.5 years for their euro area peers. In the case of households, Spanish debt is less sustainable than in other euro area countries, amounting to the equivalent of 107% of gross disposable income, some 13pp more than the European average. The combination of deleveraging, rebounding profitability and lower funding costs means Spanish companies are currently devoting 36.3% of their gross disposable income before dividends and interest payments to debt service. This is the lowest proportion since the end of the 20th century. The household debt burden has also eased. Households now devote 6.9% of their gross disposable income to paying interest and repaying the principal, broadly similar to the other main European economies. Consolidation of the current economic recovery and a continuation of existing benign financing conditions are crucial prerequisites for the continued reduction in financial vulnerability.
Economic history has demonstrated time and again that many economic crises are the result of the disproportionate accumulation of debt. Furthermore, crises are usually foreshadowed by excess lending growth, feeding real and financial asset price bubbles (see Reinhart and Rogoff, 2009; Laeven and Valencia, 2013). As economic agents taken on more and more debt, they become financially very vulnerable since they must devote a significant part of their net income to shouldering their debt burden. This applies to both private and public sector agents, with the sustainability of public finances being affected in the latter. Evidence shows that the more indebted companies become, the more investment suffers in response to an abrupt tightening of financing conditions, in some cases even affecting the survival of the company itself, as well as the banking sector
[1].
At a macroeconomic level, the most common measure of private sector indebtedness is the weight of private debt in GDP, both for companies and households. However, the drawback of this approach is that it fails to relate debt to the income available to companies and households for debt service. On occasions, this can provide a misleading portrayal of the underlying debt burden. A preferable approach is to relate debt to net income available for repayment, whether net profit, in the case of companies, or household gross disposable income.
The aim of this article is to provide an international comparison of the Spanish economy’s private non-financial sector indebtedness, comparing the perspective provided by the standard approach (debt-to-GDP ratio) with other more rigorous metrics, which relate private sector debt to net income available for repaying the accumulated debt stock. BIS data will also be used to analyse the “true” debt burden, relating this burden (financial costs and amortisations) to disposable net income. Here the approach is not to compare gross disposable income (before interest payments and dividends) to the stock of accumulated debt, but rather to financial costs and any principal amortisation (flow concept) in a given year – in other words, debt service.
The period under analysis is 1999-2016, providing an opportunity to analyse developments in indebtedness and debt service in the period leading up to the 2007 boom, as well as the post-crisis era to 2016. Eurostat provides information on debt, profit and gross disposable income. BIS provides data on debt service for seventeen countries. This article will focus on European nations. The goal is to determine where Spain stands relative to international peers.
The weight of private sector debt in GDP: Spain in a European context
The standard approach to analysing an economy’s level of indebtedness is to use the debt-to-GDP ratio. This is the approach the European Commission (2016) takes when looking at the non-financial private sector as part of its “Macroeconomic Imbalance Procedure”. The Commission uses a threshold of 133% to determine the existence of a macroeconomic imbalance requiring adjustment.
As can be seen in Exhibit 1, private indebtedness in the Spanish economy peaked at 215.7% in 2010, 55pp above the EU-28 average. However, the largest gap relative to the EU was reached two years earlier, a difference of 58.5pp. Since the 2010 peak, the debt-to-GDP ratio has fallen by 50pp reaching 166.1% of GDP in 2016, reducing the gap with the Eurozone average to 3.4pp, although still 13.4pp above the average for the EU-28 in 2016. However, as seen in Exhibit 2, the Spanish private sector continued to present a much higher debt-to-GDP ratio (166.1%) than Germany (106.5%), Italy (117.6%) and the United Kingdom (156.7%), though below France (185.4%). In 2016,14 out of the 28 countries in the EU-28 (Spain included) exceeded the 133% threshold for which the Commission deems there to be a macroeconomic imbalance in private debt, exceeding 300% in the case of Cyprus and Luxembourg.
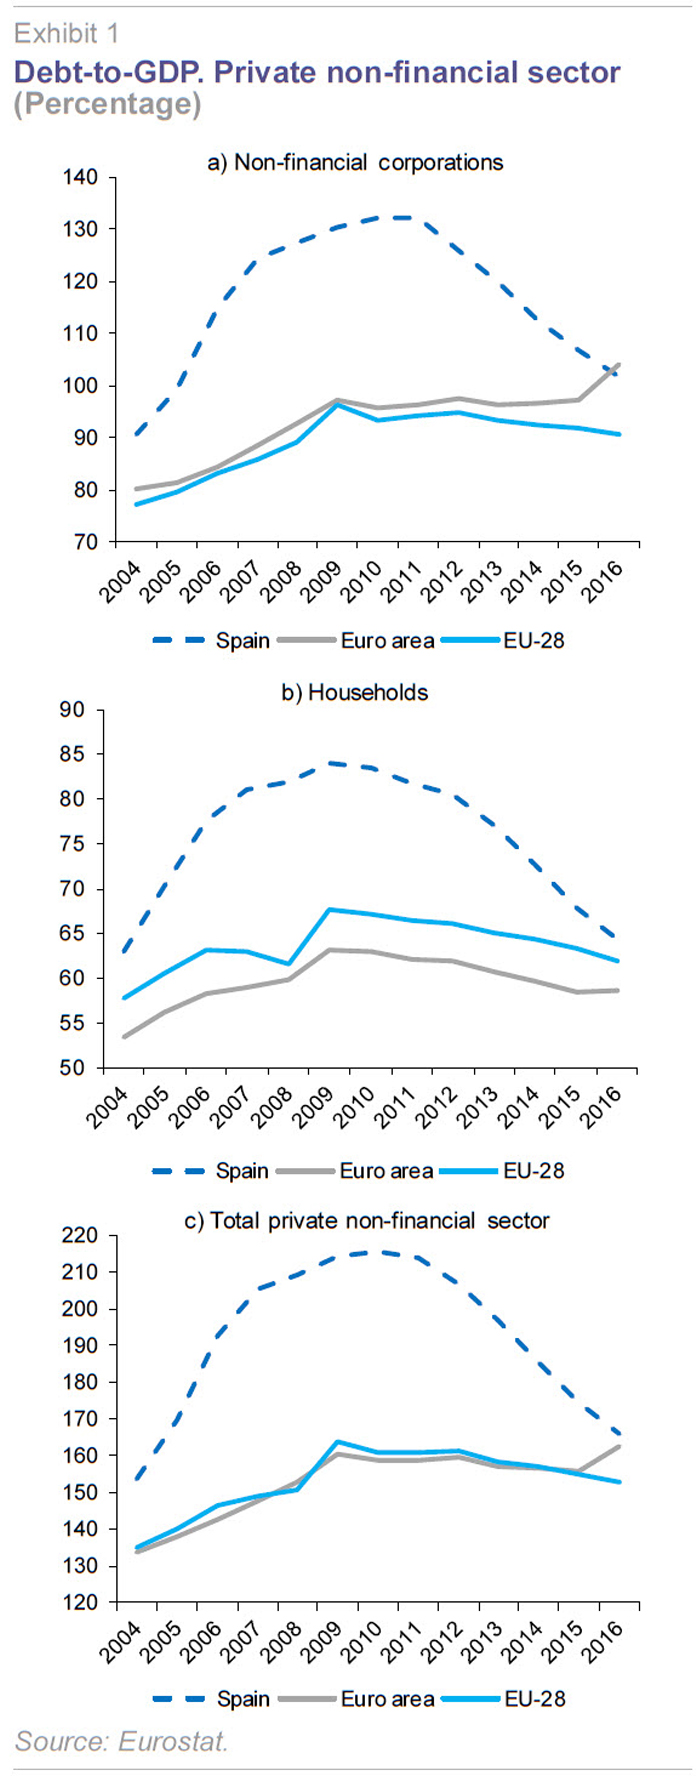
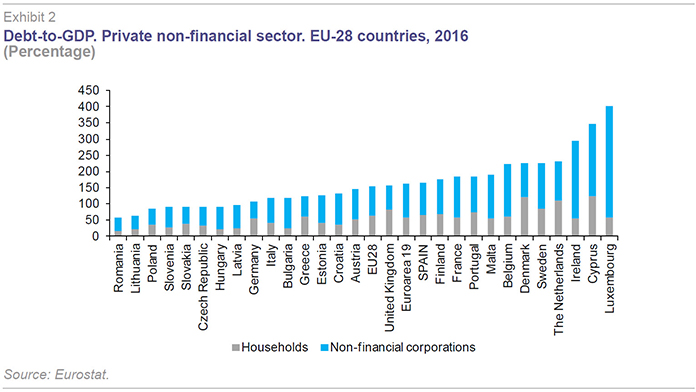
The Spanish non-financial corporate sector debt-to-GDP hit a peak of 132% in 2010-11. The over-indebtedness of Spanish companies relative to their European peers stood at around 38pp of GDP over the course of 2007 to 2011. However, since then, the difference has fallen to 10.9pp in 2016, putting the debt-to-GDP ratio at 101.7%. The latest European comparison shows that Spanish companies are still significantly more indebted than German (53.1%), British (73.5%) and Italian companies (75.8%), but less so than French corporates (128.2%).
Spanish household debt meanwhile maxed out at 84% of GDP in 2009, although the largest gap to the EU-28 (20.3pp) was recorded a year later. Since 2009, the Spanish household debt-to-GDP ratio has fallen by nearly 20pp to 64.4% in 2016. The gap to the EU-28 in 2016 was just 2.5pp, the lowest during the period under analysis. In comparison to the large European economies, the Spanish household debt-to-GDP ratio remains above Italy (41.7%), Germany (53.3%) and France (57.2%), but below the United Kingdom (83.2%).
Overall, since 2010, Spanish households and corporates have made a major deleveraging efforts, reducing debt by 482 billion euros, the equivalent of a 21% decline in absolute terms and nearly 50pp relative to GDP.
Private sector debt sustainability
A more rigorous analysis of debt sustainability should consider the fact that the income available to economic agents for repaying debt is not the economy’s overall GDP, but rather their gross disposable income. For companies, this net income corresponds to gross profit before taxes, while for households, it is their gross disposable income.
Eurostat data provides information both on corporate and household gross debt. In the case of Spanish companies (Exhibit 3), the ratio of debt to gross operating surplus (and mixed income) has consistently been above the euro area average. This ratio increased sharply by 140pp from 2004 to 2007 driven by a massive accumulation of debt, reaching 645%. In other words, in 2008, Spanish companies would have needed to repeat that year’s gross profit over more than six years in order to full repay outstanding corporate debt. This percentage remained relatively stable until 2011, and decreased continuously reaching 468% in 2015.
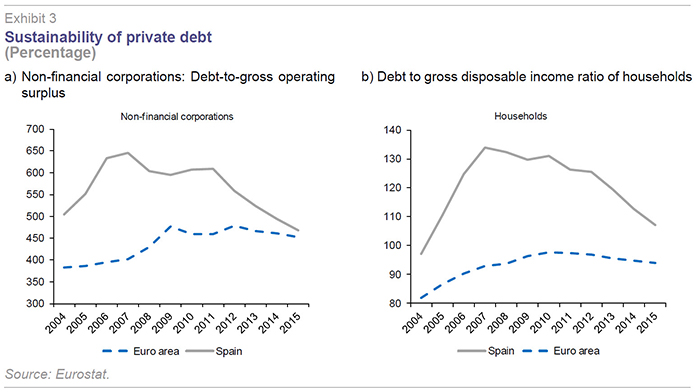
Overall, while at their worst, euro area companies needed 4.8 years to fully repay their outstanding debt, while Spanish companies required 6.5 years. The gap between Spanish and euro area companies hit a maximum of 2.4 years in 2007 and since then it has decreased, almost disappearing.
In terms of the ratio of debt-to-gross disposable income, Spanish household debt has always been more sustainable than corporate leverage. The increase in household debt during the credit boom saw this ratio double from 2000 to 2007, reaching 134%. This meant that household debt was 1.34 years greater than disposable income that year. This was also the same year in which the maximum difference was reached relative to the euro area with a gap of 41pp. Household debt sustainability has progressively improved since 2007, although in 2015 the ratio (107.2%) was still a long way above the starting point in 2000 (68%). The gap to the rest of the euro area has shrunk to 13pp, meaning that while in 2015 Spanish households (both indebted and unencumbered) would have needed to devote 107% of their gross disposable income to full paying off their debt, European household would have needed 94%.
Debt service
So far, this analysis has measured private sector debt in terms of the economy’s overall GDP, or in relation to gross disposable income available for repayment. Both measures relate to the outstanding stock of debt awaiting repayment.
A complementary perspective comes from looking at the debt burden or servicing cost. This is the effort that the private sector needs to make each year in order to cover the financial cost of the debt (interest payments and fees) and repayment of the principal. It is therefore a flow (comparing flows with flows, i.e., amount of debt amortising in a year and the financial costs borne in that year) rather than a stock approach (outstanding debt to repay).
The Bank of International Settlements (BIS) provides an indicator on debt service for the non-financial private sector. The debt service ratio measures the percentage of gross disposable income (before interest payments and dividends) used for debt service. As BIS notes, it is a useful indicator for analysing the interaction between the economy’s real and financial problems, and a leading indicator of a systemic crisis. If debt service reaches an excessive level, it can result in a failure to comply with financial obligations by households and companies, leading to an increase in defaults. Should the default ratio reach concerning levels in economies which are highly dependent on bank finance, then this could provoke a banking crisis. Simultaneously, the greater the share of income that companies and households devote to paying back debt, the less investment and consumption and therefore economic growth.
Exhibit 4 shows that debt service increased for the overall Spanish private sector over the period 1999 to 2007 from 13.3% to 24.7%, meaning that the debt burden almost doubled in just eight years. Since then, the debt burden has gradually eased back, reaching 14.9% in (September) 2016, just 1.6pp above 1999 levels.
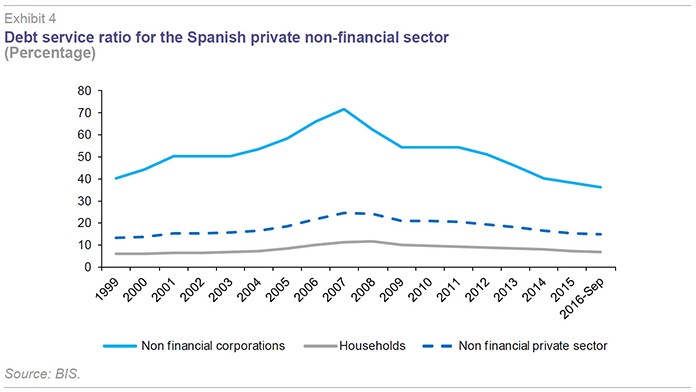
The debt service ratio has moved in a similar way over time for both households and corporates, although the level is much higher for the latter. Thus, from 1999 to 2007, the ratio increased by 31.3pp in companies, reaching a peak of 71.7%, while for households, the ratio rose 5.5pp to 11.5%. Thus, at the very outset of the crisis, companies and households were facing peak levels of debt servicing costs, with the former devoting nearly three-quarters of their gross disposable income (before interest payments and dividends) to debt repayment and the latter 11.5%.
Since 2007, debt service has dropped by 50% for companies and 40% for households. In 2016, Spanish companies devoted 36.3% of their gross disposable income to debt service and households, 6.9%. This is the lowest ratio for companies since 1999 and a similar level to the start of the century for households.
The international comparison shown in Table 1 and Exhibit 5 highlights several key messages:
- The sharp increase in debt service between 1999 and 2007 is a particularly notable feature of Spanish companies. The ratio increased by 31.3pp to 71.7%, the highest value among countries for which BIS provides data. This implies that companies devoted nearly three-quarters of their gross disposable income to paying financial costs and amortising debt, compared to 19.5% in Germany, 41.1% in France, 39.5% in Italy and 39.3% in the United Kingdom to provide some examples.
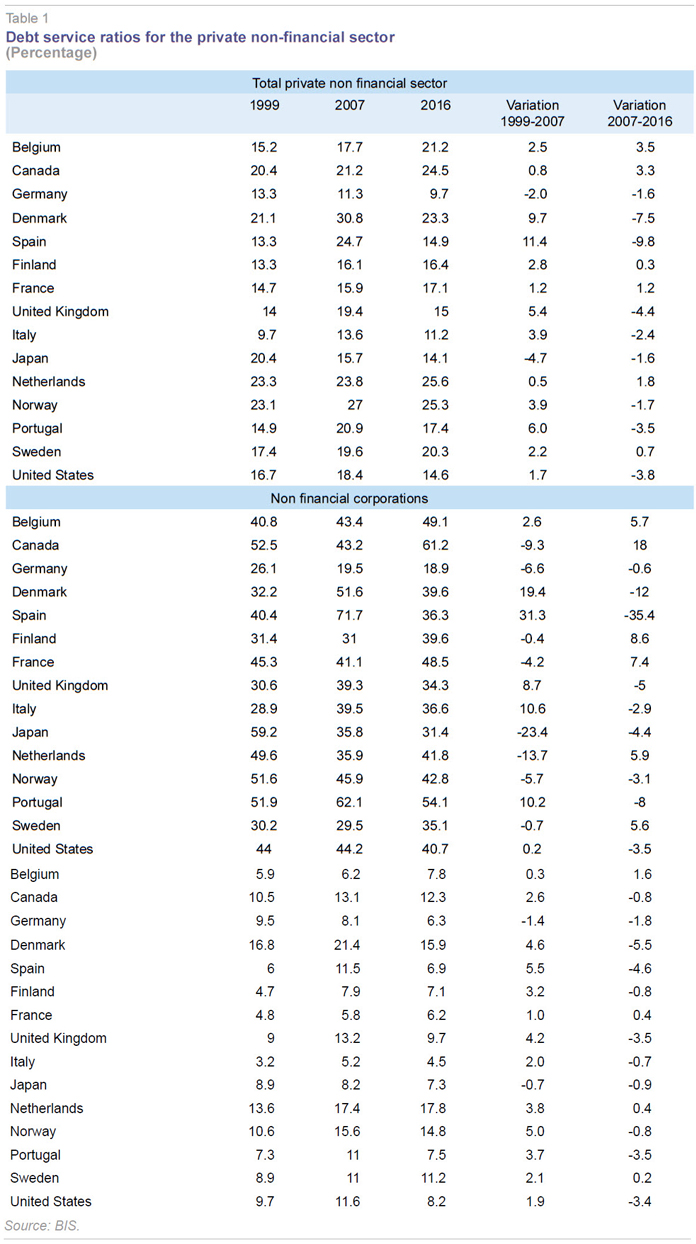
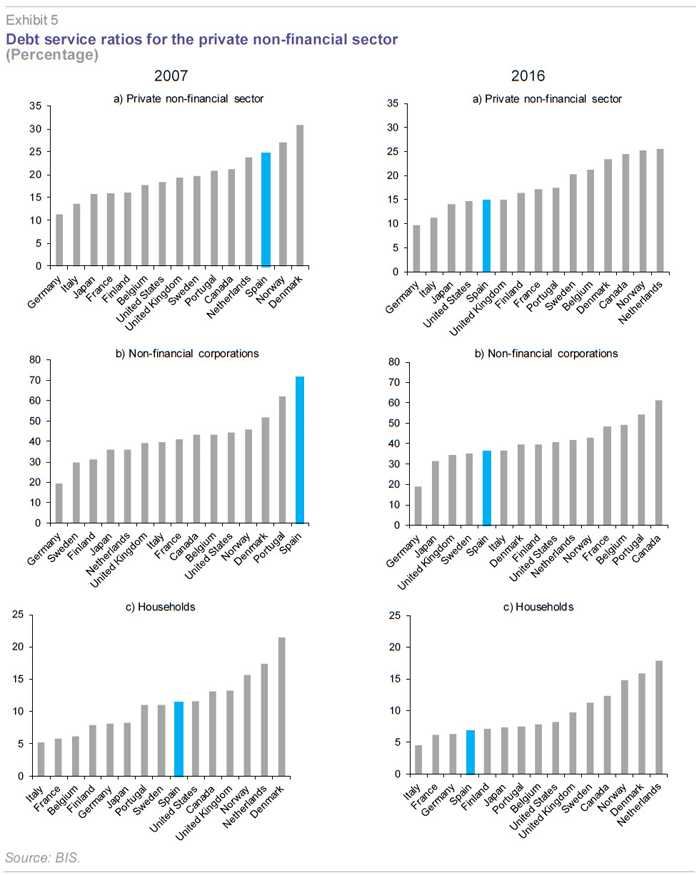
- Meanwhile, Spanish companies have registered the largest drop in debt service costs since the start of the crisis, falling by 35.4pp to 2016. In 2016, Spanish companies devoted 36.3% of their gross disposable income to debt repayment, almost double German companies (18.9%), but similar to Italy (36.6%) and the United Kingdom (34.3%) and below France (48.5%).
- The debt burden practically doubled for Spanish households from 1999 to 2007, reaching 11.5%. This was above French (5.8%), German (8.1%) and Italian (5.2%) households, but below British households (13.2%). Such debt service levels are clearly much lower than for companies. In Spain, households devoted 11.5% of gross disposable income to paying interest and repaying the principal, compared to 71.7% for companies.
- The crisis, and the subsequent deleveraging and fall in financing costs, were the main drivers behind the 4.6pp fall in Spanish household debt service to 6.9% in 2016, a similar level to 2003. In 2016, Spanish households devoted a broadly similar share of their gross disposable income to debt service as their German (6.3%) and French (6.2%) counterparts, and somewhat more than Italian households (4.5%).
- For the private sector as a whole, debt service accounted for 14.9% of the Spanish economy’s private sector income in 2016, higher than in Germany (9.7%) and Italy (11.2%) but lower than in France (17.1%) and the United Kingdom (15%). Current debt service is 9.8pp below the 2007 peak in Spain, when a quarter of disposable income went to servicing debt, well above other developed economies. Spain’s current debt burden is now at relatively similar levels to the start of the 21st century.
Conclusions
The major deleveraging effort undertaken by the Spanish private sector in recent years has led to the equivalent of a 50pp of GDP reduction in debt, which has allowed for the reduction of the gap to 3.4pp between Spain and the Euro area average. However, the level of indebtedness remains higher, almost 13.4pp above the average for the EU-28, with potential to hamper the recovery in bank lending, as well as capping consumption and investment upside – meaning there is still some work to do. Spain’s over-indebtedness relative to the EU-28 is most notable in the corporate sector, where the debt-to-GDP ratio is 10.9pp higher in Spain, while the difference is only 2.5pp at a household level.
However, a more rigorous perspective on indebtedness should also compare outstanding debt to income available for repayment. The latest data show that corporate debt amounts to 4.7 times Spanish companies’ gross margin, compared to 4.5 in euro area companies. Debt represents 107% of Spanish household gross disposable income, 13pp above euro area households. Debt levels have always been higher than the euro area average for Spanish corporates with the gap increasing until 2007, and decreasing in the following years until almost disappearing. The maximum difference for households was reached in 2007, dropping since then to 13pp in 2015.
Over-indebtedness – understood as the stock of outstanding debt relative to GDP or the income available to agents responsible for repaying it –continues to be a major source of concern since it increases the vulnerability of households and companies to a tightening of financing conditions, which eventually impacts consumption and investment. But it is even more worrying when the annual debt service flow (financial costs plus principal redemption) is misaligned with payment capacity – or the gross disposable income (before interest and dividends) available to bear the debt burden. In this regard, the state of play in the private sector has improved significantly since the start of the crisis in 2007, when debt service committed a quarter of household and corporate gross disposable income. This percentage now stands at 14.9%. Even so, it remains above the German (9.7%) and Italian (11.2%) private sector, although similar to the United Kingdom and below France (17.1%).
The situation has also improved significantly in the corporate sector. Instead of having to devote 71.7% of gross profits to debt service in 2007, companies now need to set aside 36.3%. Still a much higher proportion than German (18.9%) companies, but below French (48.5%) corporates and similar to Italian (36.6%) and British (34.3%) counterparts.
In addition to the reduction in indebtedness, the reduction in interest rates has contributed in a decisive manner to the reduction of the debt burden for the private sector and for the Spanish economy as a whole. In interest payments alone, corporates and households reduced by 83 billion euros their debt servicing costs since the start of the crisis. Therefore, an ongoing deleveraging effort together with a continuation of benign funding (interest rate) conditions will be needed to keep bringing down the debt burden. Otherwise, financial vulnerability could well deteriorate once again.
Notes
This article was writtent as part of the Spanish Ministry of Science and Innovation (ECO2013-43959-R) and Generalitat Valenciana PROMETEOii/2014/046 research projects.
As the European Commission (2016) asserts, “elevated private sector indebtedness generates a number of vulnerabilities, especially in a low-growth, low-inflation environment, which makes deleveraging difficult. In particular, it increases the impact of potential shocks on households and/or non-financial corporations, with possible repercussions on the banking sector.”
BIS (2017), Debt service ratios for the private non-financial sector.
EUROPEAN COMISSION (2016), Alert Mechanism Report 2017.
LAEVEN, L., and F.VALENCIA (2013), “Systemic Banking Crises Database”, IMF Economic Review, vol. 61, issue 2,
225-270
REINHART, C., and K. ROGOFF (2009), “The Aftermath of Financial Crises,” American Economic Review, 99(2): 466-72.
Joaquín Maudos. Professor of Economic Analysis at the University of Valencia, Deputy Director of Research at Ivie and collaborator with CUNEF