Spain’s agricultural sector: Rising discontent versus economic reality
Despite experiencing some recent tensions in 2019, the Spanish agricultural sector has performed relatively favourably over the past decade. Given the lack of strong economic justification to support a deterioration within the sector, it is plausible that the rising discontent among Spain’s farmers may be explained by a combination of other factors.
Abstract: Despite the emergence of some slightly negative trends in 2019, according to official data, the Spanish agricultural sector has enjoyed a favourable decade from a productive standpoint. Importantly, the sector’s performance was resilient in the face of the Great Recession, when other significant productive sectors of the Spanish economy experienced a collapse. While last year’s performance was further complicated by the introduction of US tariff hikes, which had a disproportionately adverse impact on certain agricultural sub-sectors, such as olive production, at the overall sector level, the recent trends in Spanish farming prices and salaries do not clearly explain the negative sentiment and rising social discontent within the sector at present. Within this context, it is plausible that the current tensions within the sector are more a product of other issues, such as uncertainty over EU agricultural support programs, as well as social issues, such as rural depopulation and ageing, the lack of business succession in certain communities, harsh working conditions and a lack of a healthy work-life balance. Although targeted public policies may contribute to improving the sector´s current conditions, a more meaningful solution to the sector’s challenges calls on farmers themselves to conduct a critical assessment of the situation and, where necessary and possible, improve their business acumen.
Production and productivity
For a few months now, the media has been covering the rising tensions within the Spanish agricultural sector. In this paper we show, from a strictly economic standpoint, how the sector has performed relatively favourably over the course of the past decade. As with any sector but perhaps more so in the case of agriculture, social issues affecting the sector need to be approached from multiple perspectives. However, the purpose of this paper is to try to shed some light from a productive standpoint. Moreover, the sector’s overall performance does not mean a uniform performance across all of its productive components. The farming income issue goes back a long way in economic literature. [1] Specifically, it is virtually impossible to find a sector policy that does not emphatically declare the need for gradual convergence between average farmer income and that of other sectors. Within this context, we focus on three tools to assess the economic performance of the sector: efficiency; prices; and EU financial support received by farmers, which is not insignificant.
First, it is important to note that Spain’s membership in the EU has had a positive impact on its agricultural sector. If, in order to mitigate the sharp year-on-year fluctuations typical of the sector, we work with three-year periods, Spain’s contribution to EU-27 GVA [2] increased by two percentage points (pp) between 1996/97/98 and 2016/17/18, rising to a share of 15.3% in the latter three-year period, which is very similar to the shares of France and Italy, having lagged behind those countries by 5pp during the first three-year period. In addition, that figure is significantly higher than the overall Spanish economy’s contribution to total EU-27 GVA in 2016/17/18 at 9.0%. [3] It can be argued that these figures, by failing to reflect 2019, could be concealing a collapse in the sector last year that could be responsible for some of the Spanish farmers’ discontent in recent months. However, that is not the case. If we go back and look at Spain’s quarterly accounts, we observe that the sum of the four quarters for 2019 is below 2018 GVA by 0.5% in both current prices and in volume terms (chained volume series), such that this factor would not appear to explain the current tensions. [4]
During the period analysed between 2007 and 2014, the Spanish economy suffered a serious recession, and it is worth noting that the impact on the agricultural sector was negligible. Given its noncyclical nature, agriculture continued to post its customary year-on-year changes, but its contribution to aggregate GVA varied within a tight range of around 2.65%, showing no clear trend in either direction between 2007 and 2014. That performance should not be underestimated considering the collapse in other significant productive sectors of the Spanish economy during the Great Recession and the massive job destruction experienced.
Looking at efficiency, we will analyse it from the point of view of labour productivity in volume terms, specifically measuring GVA at 2015 prices.
Exhibit 1 provides agricultural labour productivity figures (ALP) for the main EU-27 economies. The wide gap with respect to the European average should not come as a surprise. Overall labour productivity is the average of the productivities of its components weighted by their weight in total labour. Therefore, the agriculture sectors of less developed Eastern European economies, which still have large reserves of manpower in rural areas, has a greater weight in the EU-27 agricultural labour productivity figures. [5]
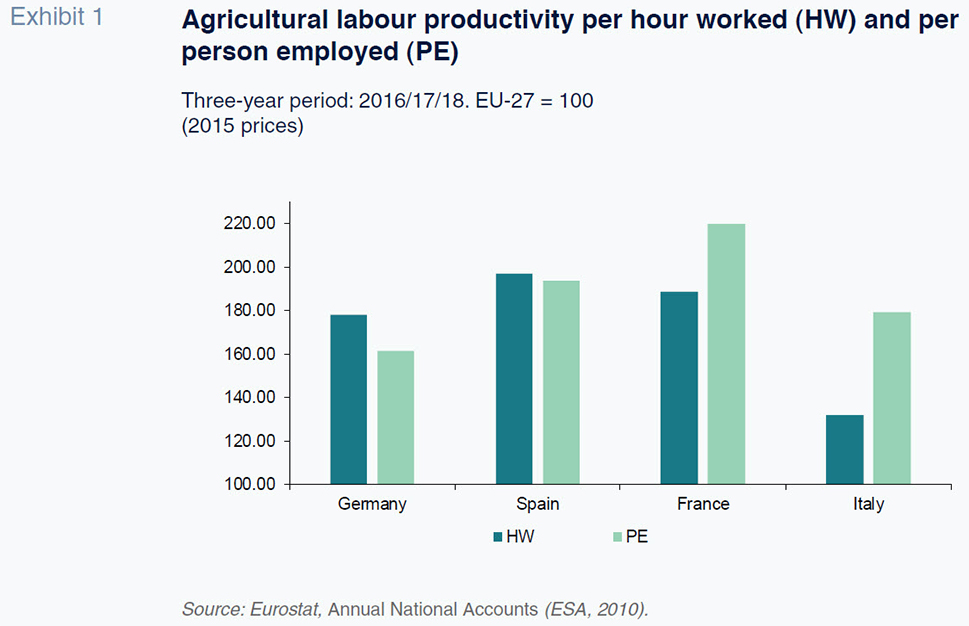
Let’s take Spain’s three main trading partners as our reference. Spanish ALP per farm worker is only lower than that of France. Focusing specifically on the labour factor in terms of hours worked –which is a far more uniform unit than the number of people employed– we note that Spain’s ALP increased to 20.4 euros (2015 prices) in 2016/17/18, a figure which truly reveals its importance if we consider that: a) it is twice the ALP recorded in 1996/97/98, similarly valued at 2015 prices; b) it is higher –without having to adjust for purchasing power parity– than that of Germany or France and significantly higher than that of Italy; c) it is equivalent to 64.9% of the labour productivity per hour for the Spanish economy as a whole, compared to levels of around 40% in the other three economies [6]; d) during the first three-year period, that relative figure was 41.2%, indicating how in Spain ATP gains have far outstripped aggregate labour productivity gains; and, e) for the Spanish economy as a whole, labour productivity per hour worked is just two-thirds that of Germany or France.
Labour productivity is one indicator of efficiency, but it is also the capacity to remunerate the factors of production used. That capacity has to be quantified on the basis of a GVA valuation in current terms, as that is what the remuneration of factors demands. It is therefore necessary to look at the farm prices trend in relative terms, which we will do in the next section. However, one of the key determinants of that capacity –real output generated per unit of work– leads to the conclusion that not only is it very high in the EU-27 context but also, in relation to the Spanish economy’s overall remunerative capacity. The gap has narrowed significantly between the first and last three-year period and, in recent years, the gap between ALP and aggregate LP has been lower than that of Germany, France, Italy and the EU-27. Accordingly, that first component has helped drive a reduction in the gap between unit farm income and aggregate income; however, it may well be that the trend in relative prices and aid received has had the effect of neutralising that traction.
Prices and salaries
The relative downturn in prices is at the centre of the agricultural protests in developed countries, and a sign of current times. The data show that the prices received by farmers have risen historically by less than those corresponding to the goods and services supplied domestically (GDP), than the prices paid by producers of consumer and capital goods and, above all, farm wages (Colino, 1990). Accordingly, only efficiency gains have enabled a fraction of farmers to stay in business, possibly helped by generous CAP grants.
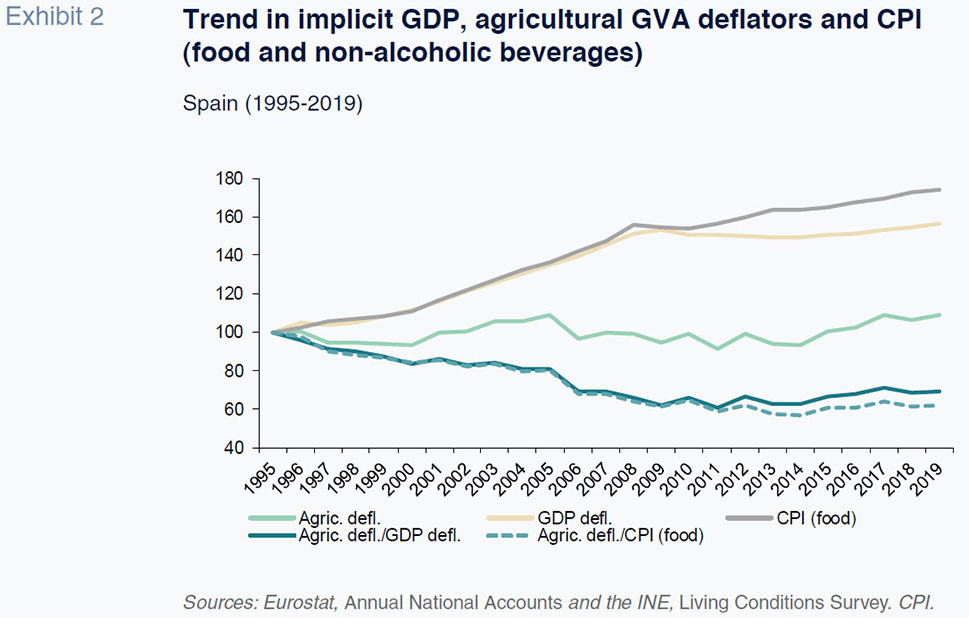
Exhibit 2 provides three price indices which refer exclusively to Spain. We have selected the implicit price deflator for GDP as our synthetic indicator within the complex series of price indices that affect farmers, additionally using the food and non-alcoholic beverages component of CPI as, in recent weeks, both the transformation industry and above all the wholesalers have been at the center of tensions. Indeed, farm prices have barely budged in the last 25 years. Exhibit 2 clearly demonstrates that the price ‘curse’ has been a constant between 1995 and 2019. The agricultural GVA deflator fluctuates within a range of between 90 and 110 and the average of the indices for the 25 years analysed in Exhibit 2 is 99.7: a simple and very clear indication of how stable farm prices have been for the last quarter of a century. In contrast, both the GDP deflator and CPI (food) registered significant growth during the first 12 years of expansion so that farm prices suffered pronounced erosion relative to the first two indices during that period. However, the picture shifts radically from 2008, due to stabilisation in the GDP deflator and the lower pace of growth in consumer food prices. The classic and widening price cuts effect observed during the first phase is replaced by discontinuation of the relative impairment of farm prices, including during the last five years, when the correlation between the various indices – agricultural GVA deflator versus GDP deflator and CPI (food) even recovers somewhat. What the official data for the overall sector tell us, therefore, is simply that relative farm prices have been placid during the last 10 years, within the endemic downward trend.
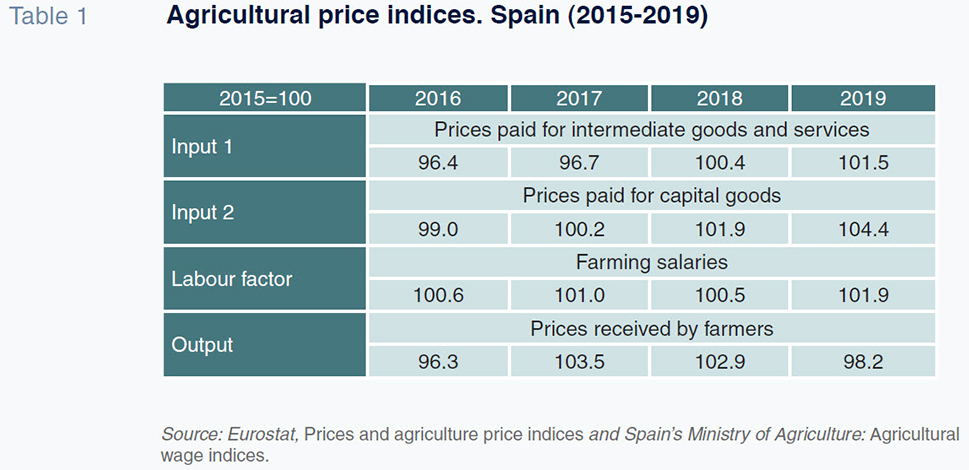
Next we look at the Economic Accounts for Agriculture, which provide more granular information, albeit limited to the farming of crops and animals. They include preliminary figures for 2019. Table 1 provides four relevant price indices for farmers. It illustrates, succinctly, that during the last five years, the predominant trend is one of stability. The indices tracking the prices paid for intermediate goods and services and the prices paid for capital goods have barely increased, totally contradicting the popular argument of harmful increases. The most noteworthy development with respect to prices received is the 4.6% contraction observed in 2019, seemingly insufficient to justify the prevailing unrest, all the more so considering the fact that it is nothing new, as the sector has had to tackle episodes of this kind with frequency in recent decades.
Agricultural wages are another matter and a source of deep concern for the media and even certain authorities (Gómez and Moraleda) due to the allegedly adverse impact of the last two minimum wage increases on farmers. Regarding the minimum wage hike of December 21st, 2018, the greater of the two (22.3%), the Ministry’s data suggest it had no impact during the first 10 months of 2019. [7] As important, however, as movements in the indices are the wage levels themselves, to which end, according to Eurostat:
- Wage remuneration –including social security payments– in the Spanish agricultural sector, amounted to 5.95 euros per hour of work in 2019. Hourly wages were even slightly lower than in 2016/17/18, during which period the Spanish figure was considerably worse than that of its large European counterparts, equivalent to 36.7% of the German figure, 29.1% of the French number and 54.9% of Italian pay.
- Recall that hourly ALP was higher in Spain than in those three economies during that three-year period (Exhibit 1). Therefore, the unit labour cost (ULC) [8] in that three-year period was 30.0%, which is very low considering that the ULC for the overall Spanish economy is 62.1%, which is slightly below that of the three benchmark economies. In other words, the gap in agricultural with respect to the aggregate indicators is much bigger in hourly wage terms than in labour productivity terms. [9]
- Latest available data show that in the fourth quarter of 2019, ULCs in the Spanish agricultural sector hit a mere 21.6%, the lowest quarterly reading in 2018 and 2019.
Therefore, at the sector level, the recent trends in Spanish farming prices and salaries do not clearly explain current tensions. To the contrary, both the LP gains and the stabilisation in relative prices have spelled a period of relative prosperity in recent years compared to earlier periods. Prosperity, which in 2019 has been clouded by a series of non-critical issues. Which is not to say that certain sub-sectors are not going through difficult patches at present. That is particularly true for olive producers: the olive oil price index, rebased to 100 in 2015, fell to 68.4 in 2019. Some vegetable producers are also suffering, albeit to a lesser extent, with declines in their price indices of 9.6% from 2015 to 2019. As a result, any agricultural policies designed to mitigate the alleged sector crisis should take a more micro approach addressing the following questions: Which are activities are experiencing difficulties that need to be addressed? Which type of farm operations are the most affected? That being said, such policy responses are outside the scope of this paper.
Income support
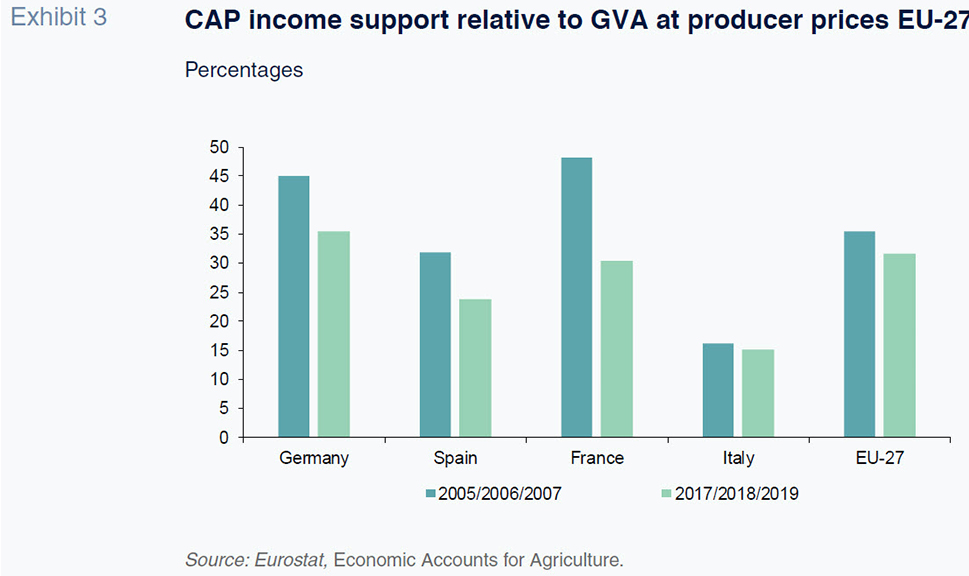
One of the classic tensions within the Spanish agricultural sector relates to the neglect of rural issues by the more developed urban community. There are certainly facts supporting this belief. However, it is important to note the aid received under the EU’s Common Agricultural Plan (the CAP) [10], which under the Multiannual Financing Framework for 2014-2020 reached an annual average of close to 55 billion euros in the EU-27, 6.5 billion euros of which went to Spanish farming. It is possible to criticise that aid but if nothing else it is important to acknowledge the fact that that financial effort –which represents around 40% of the European budget– was a significant outlay. Note that there are two types of aid: product subsidies [11], which form part of GVA at basic prices; and the so-called ‘other support’. The former have been flagging, such that today, the latter constitute the bulk of the public aid received by farmers and breeders through the basic payment and the green payment, which have been decoupled from production quantities. To measure that support, we use gross value added at producer prices (GVA pp) as our benchmark, net of subsidies received, i.e., primary income, or that derived exclusively from the production of agricultural goods.
Exhibit 3 provides the relationship between total income support received and GVA pp. It shows how in the EU-27 as a whole and in its four largest economies, the GVA percentage has declined over the period analysed. Nevertheless, the amount of aid received is considerable, representing one-third of the factor income generated by the sector in the EU-27, albeit marked by wide disparity from one member state to the next. The aid received by the agricultural sector in Spain has always been below the average and stood at close to 25% during the last three-year period- a matter for contention. It should be acknowledged, however, that compared to the situation prior to 1986, Spanish farming has received substantial support from European taxpayers.
We complement the above information by correlating the aid received with the labour factor, measured in annual work units (AWU), a concept which is similar to the full-time equivalent concept used in national accounting. The annual average for 2017/18/19 is 6,000 current euros per AWU. In Spain, that figure rises to 7,500 euros and in Germany to 14,500 euros. Returning to Spain, that annual average was equivalent to 70% of the minimum wage prevailing throughout the three-year period, which should help cement an accurate perception of the scale of the public support received by Spanish agriculture. That being said, the support is very uneven by segment, being well above the average in cereals, oil seeds, protein crops, cattle breeding and beef and much lower in grain-fed animals and vegetables. In the olive groves, the segment suffering the most from falling prices, aid in relation to output is slightly above the average. [12]
The generosity of that support entitles European taxpayers to question its effectiveness and fairness, among other things because it implies a notable opportunity cost considering some of the challenges facing the EU in the global economy in which we operate. [13] In our opinion, the CAP should prioritise the effort to halt depopulation, which calls for significant reinforcement of its second pillar –rural development– and the role the sector can play in mitigating the risks of climate change, with farmers needing to take stock of the fact that they are destined to be one of the most affected constituents. Although it is obvious that certain agricultural activities have a role to play in conserving the environment, this is not always the case. According to Eurostat, in 2018, the agricultural sector was responsible for 15% of total greenhouse gas emissions in the EU-27 (a figure that rises to 19% in Spain). In the context of the sector’s contribution to aggregate GVA –less than 2% in the EU-27 and 3% in Spain– we are clearly talking about a productive sector characterised by high emission intensity. Furthermore, since 2008, the first year for which this information is available, overall emissions in Spain have fallen, while clearly rising in the agricultural sector. As a result, the environmental conditionality of the CAP support needs to be reinforced with respect to aspects such as this. [14]
Income and its functional distribution
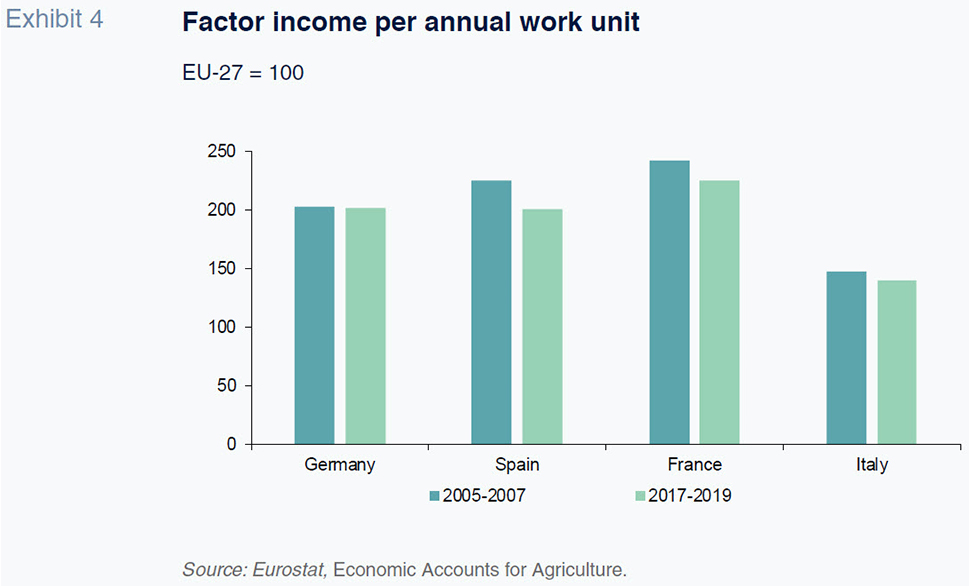
To analyse income and its functional distribution, the most appropriate variable is factor income, which includes primary income and subsidies. Spain ranks first, again using the annual average for the 2017/18/19 three-year period, at very close to 28 billion current euros, with France ranking second. However, Spanish factor income per annual work unit (AWU) (Exhibit 4) was 29,100 euros, which, without correcting for purchasing power parity, was below the French reading by 11%. [15] That figure stands out very favourably in comparison with virtually all of the main indicators of income in the Spanish economy. The reason for the huge difference in the four major economies with respect to the EU-27 average was outlined in the section analysing labour productivity. The fact that unit income during the three-year period of reference matches that of Germany and exceeds that of Italy only further highlights what an outlier it is. This time around, however, the annual average for 2017/18/19 does mask a negative performance in 2019. Rebased to 2017, Spanish factor income per AWU decreased by 9.2% in current prices and by 11.2% in real terms (using the GDP deflator) in 2019. Here we do have an economic factor that could explain some of the current discontent. It certainly would be a key determinant if it were part of a structural trend, which we believe remains to be confirmed, even though so many in the media and politics have rushed to conclude this is the case.
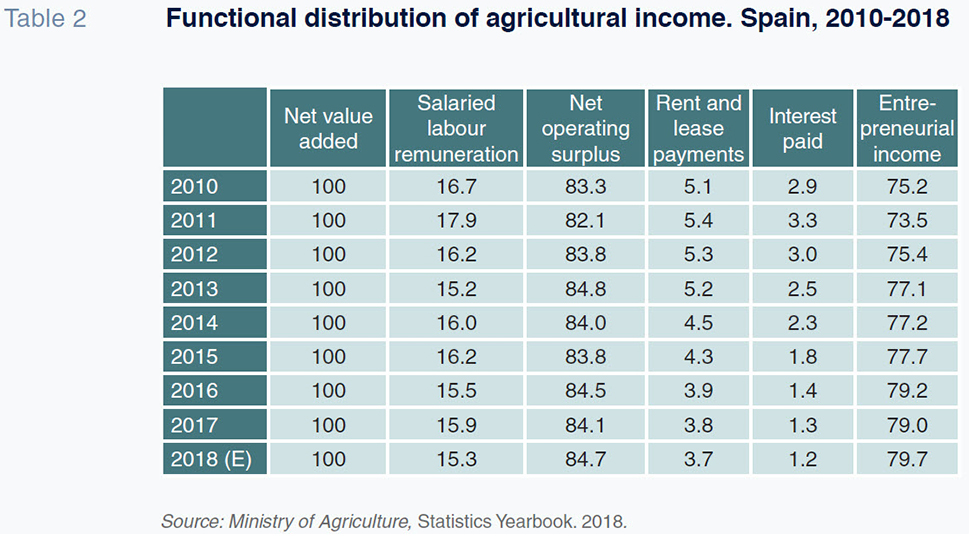
Statistics published by Spain’s Ministry of Agriculture enable a brief analysis of the functional breakdown of the agricultural income the Ministry identifies with national value added (NVA) (Table 2). First, it is worth noting that the latter variable has performed well between 2010 and 2018, registering cumulative average growth of 2.2% in real terms (using the GDP deflator), offering yet another satisfactory outcome in light of the evolution of the Spanish economy during the first four years of that period. If the pending 2019 figure implies a pause in that upward trajectory, it is still worth reiterating that, during the period for which the data are available, the improvement has been palpable. As for the functional distribution, there has been a low contribution by salaried labour remuneration, which has been trending slightly lower, moreover. Accordingly, the net operating surplus, which comprises the remuneration of capital and self-employed work, accounts for the bulk of agricultural income. Rents and lease payments, coupled with interest paid, are small items and are trending lower. The interest paid by farmers declined from 700 million euros on average per annum in 2010 and 2011 to 373 million euros in 2017/18, i.e., it has fallen by half, a development that has gone largely unnoticed. In the meantime, entrepreneurial income has increased significantly in absolute and real terms: it grew at a compound average annual rate of 3.6% between 2010 and 2018, contradicting the alleged hardships suffered by the overall sector in recent years.
Conclusion
Despite popular perception, and notwithstanding the several modest challenges in 2019 –affecting certain sub-sectors within crop production– the Spanish agricultural sector has enjoyed a relatively favourable decade from the strictly productive standpoint, as evidenced by the official statistics. While the discontent in the sector should not be dismissed, we did not find solid economic arguments for the current high level of tensions. Without question, the tariff hikes introduced by Trump (in effect since October 18th, 2019), which are logically affecting the most heavily exported crops (wine, citrus fruits and, in particular, olive oil), are adding further difficulties for activities that are not currently thriving; however, detailed examination of this specific aspect is beyond the scope of analysis. The uncertainty generated around CAP financing against the backdrop of the Multiannual Financing Framework for 2021-2027, rural depopulation, population ageing, the lack of business succession and the harsh working conditions implicit in certain activities that prevent a healthy work-life balance may have a lot more to do with the prevailing discontent than the indicators we have analysed. The scant participation by farmers and breeders in the sale and transformation of their products, [16] which is very low in comparison with other member states, may be contributing to some of the prevailing unrest. Addressing that shortfall, however, not only requires public incentives but also a substantial improvement in the sector players’ business acumen.
Notes
Two classical references by way of illustration: OECD (1964) and OECD (1965).
The source used is Eurostat: Annual National Accounts (ESA, 2010). Accordingly, in this heading, the sector comprises the farming of crops and of animals, forestry, fishing and fish farming. The first two categories represent 90% of agricultural output in Spain.
The 4Q19 figure from Eurostat is only available for four countries as of the time of writing this article (February 24th, 2020), including Germany and Spain; that is why the annual 2019 figure is not available for the EU-27, or for France/Italy. In the second halves of 2018 and 2019, Spanish agriculture GVA trended as follows in volume terms (2015=100): Q318 = 90.9; Q418 = 124.2; Q319 = 91.2; Q419 = 118.3. In sum, marked seasonality and a small year-on-year reduction in the fourth quarter.
For example, agricultural employment in Romania is very similar to sector employment in Germany, Spain and France combined.
Germany = 39.9%; France = 40.5%; Italy = 38.6%. In the EU-27 as a whole, the ALP share of LP per hour worked falls to 30.1%.
In 2019, the Ministry’s index does not include data for November and December.
We are referring to the ratio between agricultural income per unit and labour productivity per hour in 1995 prices for both variables, i.e., the fraction of labour productivity which employers have to earmark for paying salaried labour.
The comparison with the agricultural ULC measure is not meaningful. Note that the ULC measure is only economically meaningful when the percentage of salaried labour reaches a certain threshold, i.e., when the productivity of salaried labour is a good proxy for that of non-salaried labour. In Spain that percentage is 57.4% of hours worked, which is much higher than in France and Italy and, albeit to a lesser degree, lower than in Germany. In all probability, the ALP of salaried labour would be considerably higher than that of non-salaried labour for a simple reason: salaried employees tend to work on larger-scale farming operations, which present much higher than average LP figures. As a result, the ULC measure is considerably overstated for farms where most workers are not on salaries. That is evident in the fact that the ULC is around 100% in the agricultural sectors in Germany, France and Italy, rendering the result non-meaningful. That same bias, albeit to a lesser extent, is also present in the ULC measure for the Spanish agricultural sector.
Another piece of the puzzle is the significant deficit the former agricultural social security system used to represent; that system has been replaced by two schemes for salaried labour and self-employed agricultural workers. Those reforms do not appear to have significantly changed the fact that farmer pensions, decisive in the living standards of a rural society of advanced age, are largely financed by the general regime contributors.
The taxes levied on agricultural products in Europe are nil or negligible.
Source: Spanish Ministry of Agriculture, National Agriculture Accounting Network.
Challenges which are very hard to tackle with a budget that represents 1% of EU-27 GDP.
For a broader analysis of the sustainability of the Spanish farming sector, refer to Gómez Limón and Reig (2013).
For a detailed study of agricultural income in Spain and the EU, refer to Grande (2018).
A matter beyond the scope of this paper, please refer to Aznar (2013).
References
AZNAR, J. A. (coord.). (2013). Las cadenas de valor globales y el sector agroalimentario [Global value chains and the agrofood sector]. Cuadernos de Estudios Agroalimentarios, No. 4. Almería: Cajamar.
COLINO, J. (dir.) et al. (1990). Precios, productividad y rentas en las agriculturas españolas [Spanish farm prices, productivity and income]. Madrid: Mundi-Prensa.
GÓMEZ LIMÓN, J. A. and REIG, E. (coord.). (2013). La sostenibilidad de la agricultura española [The sustainability of Spanish agriculture], Serie Sostenibilidad, 03. Almería: Cajamar.
GÓMEZ , V. and MORALEDA, F. (2020). La agricultura española y el salario mínimo [Spanish agriculture and the minimum wage]. El País, February 14th, 2020.
GRANDE, J. (2018). Evolución de la renta agraria en España y la UE. Factores explicativos y evolución de las desigualdades regionales [Trend in agricultural income in Spain and the EU. Regional imbalances: explanatory factors and trends]. Revista de Estudios Agrosociales y Pesqueros, No. 250: pp. 191-220.
OECD. (1964). Les faibles revenus dans l’agriculture [Income weakness in agriculture]. Paris.
– (1965). L’interdependence des problemes du revenu et de l’offre agricoles [The interdependence between income problems and agricultural supply]. Paris.
José Colino Sueiras. Uiversity of Murcia